Metadata
Report Information
- Version: 1.2
- Last Updated: January 27, 2025
Report developed by:
- Rosemary Hartman (California Department of Water Resources (CDWR, Rosemary.Hartman@water.ca.gov)
- Nicholas Rasmussen (CDWR)
- Lara Mitchell (US Fish and Wildlife Service)
- JohnFranco Saraceno (CDWR)
- David Bosworth (CDWR)
- Jason DuBois (California Department of Fish and Wildlife)
- Michael Koohafkan (CDWR)
- Louise Conrad (Delta Science Program)
- Sam Bashevkin (Delta Science Program)
Overview
Long-term ecological surveys have been a core function of the Interagency Ecological Program (IEP) since the program’s inception in the 1970s. The IEP Seasonal Monitoring Report presents the full time series for selected water quality, plankton, and fisheries surveys conducted by IEP in a single graphical report. While the report is not a comprehensive view of all the data collected by IEP, it is intended to provide a general overview of the longevity and breadth of IEP survey work. A major goal of this report is to illustrate the scope of IEP surveys and emerging trends in the San Francisco Bay-Delta ecosystem to the public, potential science collaborators, and IEP and other resource agency managers and directors. The report is generated on a quarterly basis, with different set of ecosystem variables and surveys highlighted in each season. The report is developed by IEP scientists (including leads for monitoring surveys and the IEP Lead Scientist) and is reviewed by the IEP Science Management Team and Coordinators before online publication.
General Information
Season Definitions
This report covers a suite of key IEP data sets relevant each season. For data sets collected throughout the year, such as water temperature, we only used data from this three-month period to generate graphs. For data sets that are season-specific, we include the entire sampling period, even if it does not overlap exactly with our season definition (for example, the 20mm Survey index includes data from March-July, whereas the spring season is defined as March-May).
- Spring = March to May
- Summer = June to August,
- Fall = September to November, and
- Winter = December to February, with January and February included with December of the previous year
Geographic Region Definitions
Many of the data sets in the report are represented by a panel of three plots, one for each of three geographic regions: San Pablo Bay, Suisun Bay, and the Sacramento-San Joaquin Delta. This subdivision of data sets is designed to facilitate comparison among major regions that differ in a variety of characteristics. San Pablo Bay includes data collected east of Point San Pablo and west of the Carquinez Straight. Suisun Bay includes data collected east of the Carquinez Straight and west of the town of Collinsville. The Delta includes data east of Collinsville. Data sets are represented as a single graph when the data are only collected within a single region (e.g., Net Delta Outflow) and for wide-ranging organisms that frequent multiple regions (e.g., Delta Smelt).
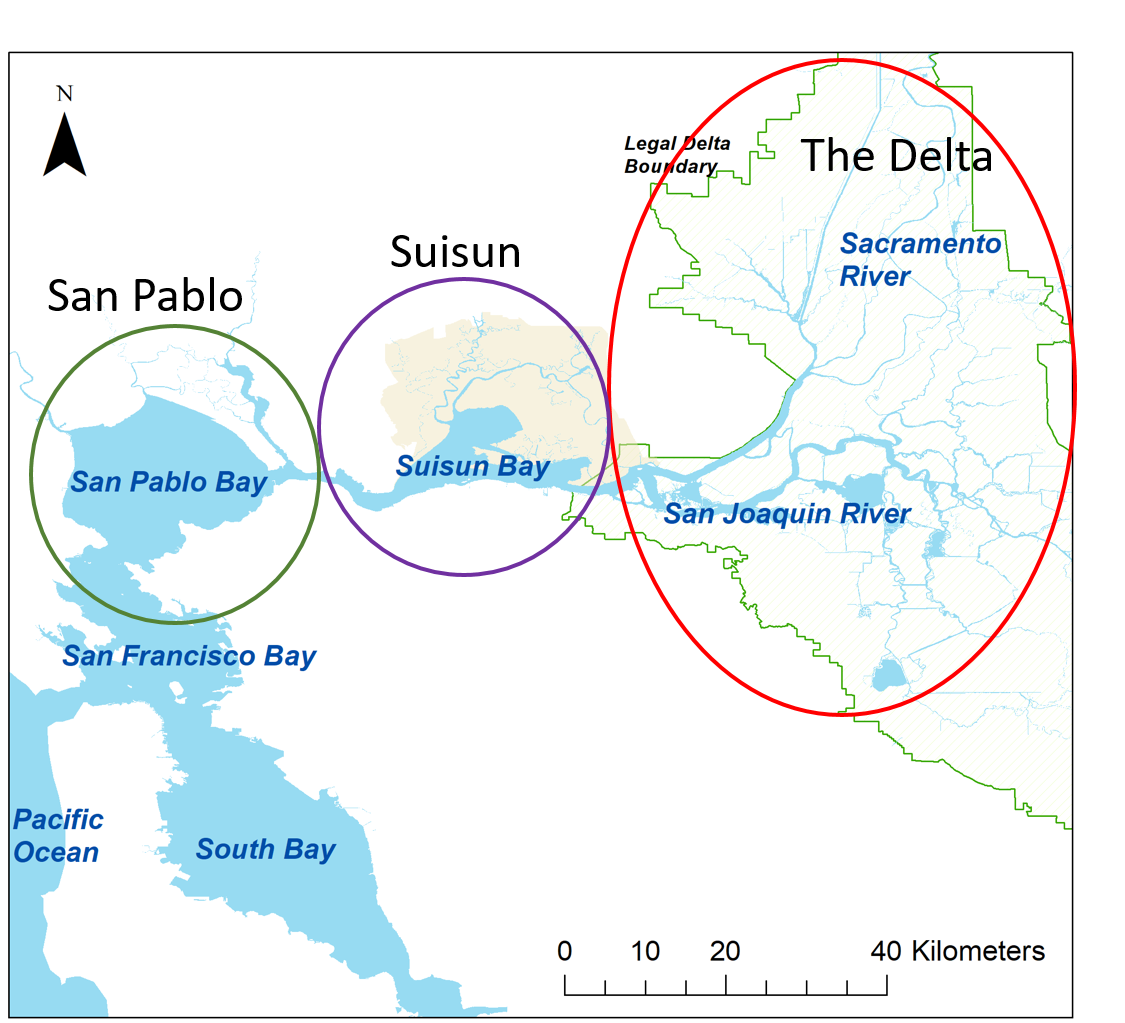
Figure 183: Map of the estuary with circles around San Pablo Bay, Suisun, and the Delta
Figure 1. Map of geographic regions of the Estuary.
Year Ranges
Most of the graphs in the report have an x-axis range from 1966 to the current report year. This start year was selected because it is the year of initiation for the Fall Midwater Trawl survey, one of the longest-running surveys. Standardizing the year range on the x-axis facilitates visual comparison across data sets. The entire time series for nearly all data sets fits within this time range. Data sets that started before 1966 were truncated in this report, for purposes of consistency within the report. The graphs in the Recent Trends section of the report range from 2004 to the current report year.
Note that COVID-19 caused several interuptions in sampling, resulting in missing data at several points in 2020 and 2021.
Calculations for Data Points
The points plotted on the graphs represent mean values. Means are generated by averaging data over the three months of the season for a given year and across sites within a given region where relevant (e.g., water quality and plankton data sets). The dotted horizontal line indicates the average value over the entire period of record.
Figure Captions
Most figure captions reflect whether a quantity is lower than, higher than, or close to the long-term average, where ‘close to’ currently means within the range defined by plus or minus 10% of the long-term average. If a quantity is not available for the current report year, the long-term average is reported in the caption. We are working on code to generate these captions automatically.
Data Sets
Flow (All Seasons)
Data Source: Department of Water Resources, Environmental Planning and Information Branch
Metric Used: Net Delta Outflow Index, which is estimated using a summation of river inflows, precipitation, agricultural consumptive demand, and project exports. Dayflow is computed once per year following the start of the new water year (October 1). At that time official QA/QC’d data is requested from several water quality monitoring stations. Once all input data is received, Dayflow estimate of Delta outflow is computed.
The Dayflow estimate of Delta outflow is referred to as the “net Delta outflow index” (NDOI) because it does not an account for tidal flows, the fortnight lunar fill-drain cycle of the estuary, or barometric pressure changes. It is a quantity that never actually occurs in real time. Rather, it is an estimate of the net difference between ebbing and flooding tidal flows at Chipps Island (~ + / - 150,000 cfs), aliased to a daily average. Depending on conditions, the actual net Delta outflow for a given day can be much higher or lower than the Dayflow estimate. Dayflow Net Delta Outflow vs Net Delta Outflow Index provides an example comparison of Dayflow output with measured daily average outflow.
Start Year: 1929
Data may be accessed on the CNRA Data Portal
Water Quality: Secchi depth, Temperature, Chlorophyll-a (All Seasons)
- Data Source: Department of Water Resources, Environmental Monitoring Program
- Metric Used: Monthly discrete water quality data
- Start Year: 1975
- Stations by Region - Location and number of stations has changed over time
- San Pablo: Stations = 1-3, years: 1975-2018
- Suisun: Stations = 5-8, years: 1975-2017
- Delta: Stations = 11-20, years: 1975-2017
- Data is published on the Environmental Data Initiative Website
- Additional Information: https://iep.ca.gov/Science-Synthesis-Service/Monitoring-Programs/EMP
Zooplankton: Biomass of Calanoids, Cyclopoids, Cladocerans, and Mysids (All Seasons)
Data Source: California Department of Fish and Wildlife, Zooplankton Study
Metric Used: Biomass of zooplankton (milligrams of carbon per cubic meter) based on monthly surveys. The Environmental Monitoring Program (EMP) Zooplankton Study (also known as the IEP Zooplankton Study) began in 1972 in order to assess trends in fish food resources ranging from San Pablo Bay to the east Delta, as well as to detect and assess the impacts of recently introduced zooplankton species on native species. The study is mandated by Water Right Decision 1641 for operation of the State Water Project and Central Valley Project. The EMP study is conducted by CDFW in collaboration with DWR, and the US Bureau of Reclamation (Reclamation) and currently samples 17 fixed stations and 2 floating entrapment zone stations (locations where the bottom salinity is 2 and 6 PPT). There are also 3 additional stations located in Carquinez Strait and San Pablo Bay, which are sampled during periods of high outflow and low salinity. Historically (prior to 1995) the survey sampled at a much larger number of stations.
Zooplankton for EMP are sampled in 3 different size ranges: microzooplankton, including most cyclopoid copepods, are sampled using a pump, mesozooplankton, including most cladocera and calanoid copepdos, are sampled using a modified Clarke-Bumpus net, and macrozooplankton, including mysids are sampled using a mysid net. All EMP zooplankton are collected monthly at fixed stations year-round in open channels at high slack tide and preserved in 10% formalin dyed with rose bengal. Macrozooplankton and Mesozooplankton are collected using 10-minute oblique tows with a 124 cm long net with 505 µm mesh, and a 73 cm long net with 160 µm mesh, respectively. Both nets have a General Oceanics mechanical flowmeter attached to meaure volume sampled. Prior to 1974, macrozooplankton were sampled with a 930 µm mesh net. Microzooplankton are collected with a Teel marine pump while the intake hose is raised through the water column and pumped into a net with 43 µm mesh. Pump samples collected approximately 1.5 - 1.9 L from 1972 – 2007, and 75 L from 2008-present, measured by a digital flowmeter connected to the hose. Organisms in these samples are identified and counted by taxonomists at the CDFW laboratory. Mysids are also measured to the nearest millimeter. Biomass of cyclopoid copepods, calanoid copepods, and cladocera is calculated by multiplying catch-per-unit-effort by average biomass for each taxa. Biomass of mysids is calculated using length-weight regressions and estimating carbon content to be 40% of dry weight.
Start Year: 1975. Note: Winter sampling did not begin until 1995.
- Stations by Region
- San Pablo: Stations = 2, start year: 1998. Note: One station sampled consistently since 1998 and the other one since 2003.
- Suisun: Stations = 6, start year: 1975
- Delta: Stations = 8, start year: 1975
- Additional Information:Zooplankton Study
- Data is also published on the Environmental Data Initiative Website
- Stations by Region
Juvenile Winter-run Chinook: Chipps Island Trawl (Winter and Spring Reports)
Data Source: US Fish and Wildlife Service, Lodi Field Office, Delta Juvenile Fish Monitoring Program
Metric Used: Mean catch per unit effort estimates for Winter-run Chinook. The calculation method is similar to that used by DJFMP staff for reporting.
The Chipps Island Trawl is a midwater trawl that targets juvenile salmonids and operates three days per week, ten tows per day, throughout the year. During each sampling day, staff attempted ten 20-minute tows between approximately 7am and 1pm, though night sampling did take place in some historical years. Tows were generally conducted facing into the direction of flow (either upstream or downstream, depending on tide). The reach length is approximately 4 km. The measure of the distance traveled during each tow was recorded using a calibrated mechanical flow meter (General Oceanics, Model #2030) deployed alongside the boat.
Staff identify all fish in each sample that were ≥ 25 mm fork length (FL) to species or race and measure fish to the nearest 1 mm FL. If greater than 50 individuals of a Chinook Salmon race, as designated by the river length-at-capture-date criteria, or other species listed under the Endangered Species Act (ESA) are captured, a subsample of 50 individuals is randomly measured for FL and the rest are counted and not measured. For non-listed species, if greater than 30 individuals of a non-listed species are captured, a subsample of 30 individuals is randomly measured for FL and the rest are counted and not measured. Fish that could not be accurately identified in the field are preserved and brought back to the laboratory. The identification of preserved fishes is then confirmed with the use of dichotomous keys and/or with the aid of a microscope. The race of all unmarked juvenile Chinook Salmon (i.e., no adipose fin clip to indicate that it is a hatchery fish) was determined using the river LDC developed by Fisher (1992) and modified by Greene (1992). The LDC is currently widely used by managers, and is the only cost effective and logistically feasible way to differentiate between the different races of juvenile Chinook Salmon in the field. However, many of the Chinook Salmon characterized as spring-run by the river LDC may actually be fall-run. The race designations should be considered a rough approximation and not interpreted as definitive.
Start year: 1995. Note: Although sampling at Chipps Island started in 1976, this year range was chosen for consistency with the range most recently reported on by DJFMP staff.
Stations: 1
Additional Information: https://iep.ca.gov/Science-Synthesis-Service/Monitoring-Programs/Delta-Juvenile-Fish
Data is also published on the Environmental Data Initiative Website
Adult Spring-run Chinook and Fall-run Chinook: GrandTab (Spring and Fall Reports)
- Data Source: CDFW’s Grand Tab database as queried from SacPass.
- Metric Used: The CDFW Fisheries Branch Anadromous Resource Assessment Unit compiles annual population estimates of Chinook salmon, Oncorhynchus tshawytscha, in the Sacramento San Joaquin River system. The GrandTab report is a compilation of sources estimating the late-fall, winter, spring, and fall-run Chinook salmon total populations for streams surveyed. Estimates are based on counts of fish entering hatcheries and migrating past dams, carcass surveys, live fish counts, and ground and aerial redd counts. Estimates are provided by the California Department of Fish and Wildlife, the US Fish and Wildlife Service, the California Department of Water Resources, the East Bay Municipal Utilities District, the US Bureau of Reclamation, the Lower Yuba River Management Team, and the Fisheries Foundation of California.
- Start Year: 1960
- Additional Information:https://wildlife.ca.gov/Conservation/Fishes/Chinook-Salmon/Anadromous-Assessment
Splittail: Yolo Bypass Screw Trap (Spring Report)
Data Source: DWR’s Yolo Bypass Monitoring Study
Metric Used: Catch per unit effort (fish per hour), computed as the annual catch for the season divided by the rotary screw trap operational time.
The rotary screw trap is deployed at levee mile 14.5 near the base of the Yolo Bypass Toe Drain and is typically operated from January 1st through June. If the first flush of the system occurs earlier, the screw trap will be deployed in December to capture out-migrating fishes. Trap dimentions are: Length: 22.5 ft, Width: 12 ft, Weight: 1300 lbs, Cone: 8 ft diameter and 9 ft length with 2 ft on each end for shaft (total of 13 ft), Livebox: 4 ft by 5 ft with a 25 ft3 volume. During high flows and periods of high debris, the trap may be set intermittently through-out the day, or not set if the high flow becomes a safety concern. The trap is checked daily and upon checking or pulling the trap fish are then collected using dipnets and transferred to separate buckets. Each fish is identified, counted, and then fork length to the nearest millimeter is measured for up to 20-50 individuals of each species.
Start Year: 1998
Stations: 1
Additional Information: Yolo Bypass Fish Monitoring Program
Data is published on EDI
Delta Smelt, Striped Bass, Longfin Smelt, American Shad: Fall Midwater Trawl (Fall Report)
Data Source: California Department of Fish and Wildlife
Metric Used: Annual abundance indices are the sum of the four (September-December) monthly indices, which are calculated by averaging catch per tow for index stations in each regional area, multiplying these means by their respective weighting factors (i.e., a scalar based on water volume) for each area and summing these products for all 17 areas.
The midwater trawl net has mouth dimensions of 12 ft x 12 ft when stretched taught, but mouth dimensions will be smaller when under tension during a tow. Net mesh sizes graduate in nine sections from 8-inch stretch-mesh at the mouth to 0.5-inch stretch-mesh at the cod-end. All four corners of the net mouth are connected to planing doors, which together counteract the drag on net material and hold the net mouth open when being towed through the water. At each station a 12 minute tow is conducted during which the net is retrieved obliquely through the water column from bottom to surface. All fish, shrimp, and jellyfish are identified and enumerated.
Start Year: 1967. Note: No sampling in 1974 or 1979. Also, the month range of this survey deviates from the standard September-November definition of fall in this report. It typically takes place September-December. In some years past, however, it started as early as July and/or ended as late as March.
Stations: 100 stations are used to calculate the index (out of 122 stations sampled)
Additional Information: FMWT
Data is available on the CDFW File Library
Adult White Sturgeon: Sturgeon Study (Fall Report)
- Data Source: California Department of Fish and Wildlife, Sturgeon Study
- Metric Used: Catch per unit effort based on standardized trammel net surveys
- Start Year: 1967. Note: Survey conducted intermittently 1967-2004 and annually since 2005. Fall season for this study is August-October.
- Additional Information: Sturgeon Study
Juvenile White Sturgeon: San Francisco Bay Study (Winter Report)
- Data Source: California Department of Fish and Wildlife, San Francisco Bay Study (Region 3, Bay Delta)
- Metric Used: Year-class index (YCI) calculated by methods described in Fish 2010
- Data source: Fish CPUE and Index calc_July2019.accdb (standalone database, copy received from Bay Study personnel)
- Start Year: 1980. Note: Annual survey conducted monthly in the bays, estuary, & delta. Deploys otter & mid-water trawls. Sturgeon YCI calculated using otter trawl only (Fish 2010).
- Stations: 52
- Additional Information: Bay Study
- Data is available on teh CDFW File Library
Adult Longfin Smelt and Northern Anchovy: San Francisco Bay Study (Winter and Summer Reports)
- Data Source: California Department of Fish and Wildlife, San Francisco Bay Study (Region 3, Bay Delta)
- Metric Used: Average catch per unit effort (CPUE) for adult (Age 1+) Longfin Smelt is derived from Bay Study’s Midwater trawl, which samples pelagic fishes and retrieved obliquely such that all depths are sampled equally.
- Start Year: 1980
- Stations: 52
- Additional Information: Bay Study
- Data is available on teh CDFW File Library
Winter Run Chinook: Red Bluff Diversion Dam (Winter Report)
- Data Source: Red Bluff US Fish and Wildlife Office juvenile fish monitoring program
- Metric Used: Estimated number of juvenile outmigrants passing the Red Bluff Diversion Dam based on catches from rotory screw traps. Since winter Chinook spawning ground lie almost exclusively above the dam, this provides an estimate of salmon production from the upper reaches of the river.
- Start Year: 2003
- Note: Data were truncated at 2003 to focus on the more recent trends. Data are also available for 1994-2000.
- Stations: 4 screw traps across the river
- Additional Information: Red Bluff Fish Monitoring
Adult Delta Smelt: Spring Kodiak Trawl (Winter Report)
- Data Source: California Department of Fish and Wildlife
- Metric Used: Annual abundance indices are the sum of the four (January-April) monthly indices, which are calculated by averaging catch per tow for index stations in each regional area, multiplying these means by their respective weighting factors (i.e., a scalar based on water volume) for each area and summing these products for the three areas.
- Start Year: 2002
- Stations: 39
- Additional Information: Spring Kodiak Trawl
- Data is also published on the Environmental Data Initiative Website
Juvenile Delta Smelt and Longfin Smelt: 20mm Survey (Spring Report)
- Data Source: California Department of Fish and Wildlife
- Metric Used: Annual Delta Smelt indices are the sum of four survey-specific indices, each derived by calculating catch per unit effort (CPUE) per tow, calculating mean CPUE by station, and taking the geometric mean across stations. The four surveys are comprised of the two surveys directly before and the two surveys directly after Delta Smelt mean fork length reaches 20 mm. This procedure is designed to be consistent with the Delta Smelt Index calculated by CDFW. Annual Longfin Smelt indices are calculated similarly except the first four surveys are used consistently (i.e., the four chosen surveys are not conditional on Longfin Smelt length).
- Start Year: 1995
- Stations: 47 core stations (total number has varied between 41 and 55)
- Additional Information: 20mm Survey
- Data is also published on the Environmental Data Initiative Website
Sacramento Pikeminnow – Beach Seine Survey (Summer Report)
- Data Source: US Fish and Wildlife Service, Lodi Field Office, Delta Juvenile Fish Monitoring Program
- Metric Used: For a given year-month combination, Sacramento Pikeminnow catch per unit effort (CPUE) was calculated as the sum of Pikeminnow catch divided by the sum of volume sampled, over all stations sampled. The annual index was calculated as the mean of the monthly CPUE values from that year.
- Start Year: 1976
- Stations: 75 stations; see program metadata for site sampling histories.
- Additional Information: DJFMP
- Data is also published on the Environmental Data Initiative Website
Delta Smelt: Summer Townet Survey (Summer Report)
Data Source: California Department of Fish and Wildlife
Metric Used: Catches of age-zero Delta Smelt at each index station are weighted by a station-specific weighting factor, summed for all index stations and divided by 1000 to calculate the survey index. The annual index is calculated from the first two survey indices. This method was chosen for consistency with the index calculated by the California Department of Fish and Wildlife.
The townet has two sections; the first is made of 1/2” stretch, knotted, nylon, mesh 6’ long, tapering down to an additional 2’ “fyke”. This “fyke” fits entirely within the second section, a 9’ section of woven mesh with approximately 8 holes per inch. Please see the link at right for a diagram of the townet. The entire net measures approximately 15’ in total, and is lashed directly to a fixed metal “D” frame. The “D” frame is in turn mounted on a 22 pound sled. Two 10 minute stepped oblique tows are performed at each station. At historic stations, a third tow is conducted if any fish are captured during the first two tows. STN enumerates all fishes and several invertebrate species. Fork length is measured to the nearest millimeter for all striped bass, all delta smelt, and the first 50 fish per tow for all other species.
Start Year: 1959
Note: The Summer Townet Survey was initiated in 1959, but no index was calculated 1966-1968.
Stations: 31
Additional Information: Summer Townet Survey
Data are available on CDFW’s File Library
Microcystis (Summer Report)
- Data Source: Summer Townet Survey and Environmental Monitoring Program
- Metric Used: Microcystis bloom presence and intensity are measured on a qualitative scale with 5 categories: absent, low (widely scattered colonies), medium (adjacent colonies), high (contiguous colonies), and very high (concentration of contiguous colonies forming mats/scum). (see figure below). Observations were taken at all stations sampled monthly by EMP (see description of EMP sampling under Water Quality, above), and at all stations sampled twice per month by the Summer Townet Survey (see description of Summer Townet, above).
- Start Year: 2007
- Stations: 69
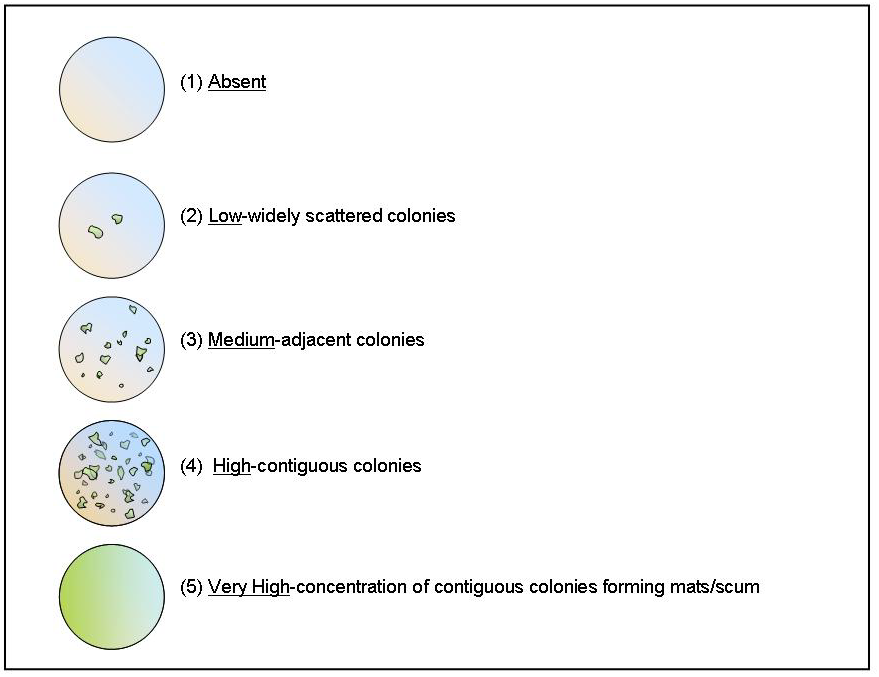
Figure 184: mean is represented by a dotted red line
Aquatic Vegetation (Summer Report)
- Data Source: Acquired from Shruti Khanna at California Department of Fish and Wildlife.
- Metric Used: Percent water area occupied by vegetation was estimated from hyperspectral imagery collected once per year. This metric was calculated for each of the two types of vegetation, floating and submerged, by dividing estimated acres of vegetation by estimated total wetted area of the Delta and multiplying by 100. Note that this is a conservative estimate of submerged aquatic vegetation because this type of vegetation is difficult to capture with remote sensing imagery. Also note that, although this plot is included in the summer report, the data were collected during most years in fall when vegetation biomass is at a maximum in the Delta.
- Start Year: 2004. No data were collected 2009-2013. These surveys have been funded in a piecemeal fashion and are not part of any agency’s formal monitoring program.
- Stations: The coverage estimates included in the plot are based on an area representing about a third of the full legal delta, including parts of the Central and North Delta. These regions have been monitored because they represent important habitat for endangered delta smelt. The region for the Central Delta ranges from the northernmost extent of Twitchell Island to the southern extent of Rhode Island in the north-south orientation and from the western extent of Sherman Island to eastern extent of Fourteen-Mile Slough in the east-west orientation. The region for the North Delta ranges from the northernmost extent of Liberty Island to the southern extent of Prospect Island in the north-south orientation and the western extents of Lindsey Slough to the eastern extent of Prospect Island.