Spring Report
This report shows trends in water quality, plankton, and fish across multiple IEP surveys for March through May from 1966 to 2024.
Delta Outflow
- Freshwater flow influences water quality, plankton, and fish populations.
- Spring flow is driven primarily by rainfall, snowmelt, and upstream dam releases.
- The long-term average is 41.9.

Figure 5: mean is represented by a dotted red line

Figure 6: Graph of net Delta outflow from 1966 to 2023. Values range from 3.3 to 161.6.
Secchi Depth
Background
- Organisms in this ecosystem are adapted to high turbidity conditions, and reductions in turbidity can have many negative ecological effects.
- Higher values for Secchi depth indicate lower turbidity.
- Secchi depth is measured monthly by DWR’s Environmental Monitoring Program by dropping a black-and-white disk in the water until it disappears.
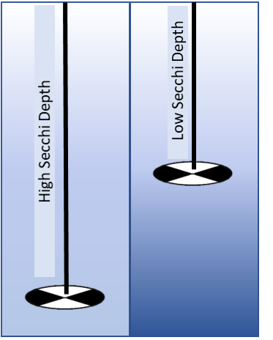
Figure 7: image of a secchi disk
Average Secchi Depth by Region
Figure 8: mean is represented by a dotted red line

Figure 9: missing data are represented by tan triangles

Figure 10: Graph of average spring secchi depth in San Pablo from 1976 to 2023. Values range from 24.6 to 146.4.

Figure 11: Graph of average spring secchi depth in Suisun from 1975 to 2023. Values range from 22.2 to 58.2.

Figure 12: Graph of average spring secchi depth in Delta from 1975 to 2023. Values range from 34.9 to 181.6.
For more information see: Schoellhamer, D. H. 2011. Sudden clearing of estuarine waters upon crossing the threshold from transport to supply regulation of sediment transport as an erodible sediment pool is depleted: San Francisco Bay, 1999. Estuaries and Coasts 34(5):885-899. https://link.springer.com/article/10.1007/s12237-011-9382-x
Water Temperature
Background
- Water temperature is monitored monthly by DWR’s Environmental Monitoring Program.
- Fish growth and reproduction is highest in certain temperature ranges.
- Increasing Spring temperatures may lower Delta Smelt reproduction.
- Temperatures tend to be similar between regions in the spring.
Figure 13: picture of a thermometer in water
Average Temperature by Region
Figure 14: mean is represented by a dotted red line
Figure 15: missing data are represented by tan triangles

Figure 16: Graph of average spring water temperature in San Pablo from 1976 to 2023. Values range from 12.8 to 17.4.

Figure 17: Graph of average spring water temperature in Suisun from 1975 to 2023. Values range from 12.6 to 17.9.

Figure 18: Graph of average spring water temperature in Delta from 1975 to 2023. Values range from 13.1 to 18.5.
For more information see: Bashevkin, S. M., B. Mahardja, and L. R. Brown. 2022. Warming in the upper San Francisco Estuary: Patterns of water temperature change from 5 decades of data. Limnology & Oceanography. doi: https://doi.org/10.1002/lno.12057
Chlorophyll
Background
- Chlorophyll is an indicator of phytoplankton production, which is low during the Spring.
- Phytoplankton are the base of the pelagic food web. It is sampled monthly by DWR’s Environmental Monitoring Program.
- The invasion of the clam Potamocorbula amurensis caused a decline in phytoplankton and zooplankton after 1986 – especially in Suisun Bay.
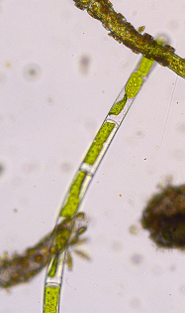
Figure 19: picture of phytoplankton
Average Chlorophyll by Region
Figure 20: mean is represented by a dotted red line
Figure 21: missing data are represented by tan triangles

Figure 22: Graph of average spring chlorophyll in San Pablo from 1976 to 2023. Values range from 1.5 to 13.3.

Figure 23: Graph of average spring chlorophyll in Suisun from 1975 to 2023. Values range from 1.0 to 18.0.

Figure 24: Graph of average spring chlorophyll in Delta from 1975 to 2023. Values range from 1.7 to 32.1.
For more information see: Brown, T. 2021. 2019 Phytoplankton Annual Report. IEP Newsletter 40(2):47-52.
Zooplankton
Background
- Zooplankton is sampled monthly by the CDFW/DWR Environmental Monitoring Program, but sampling in San Pablo Bay did not begin until 1998.
- Zooplankton are an important food source for pelagic fish.
- Calanoid copepods and mysids are particularly good fish food. Cyclopoid copepods are not as good for fish food.
- Biomass in Spring tends to be higher than Winter, but lower than Summer.
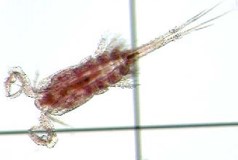
Figure 25: picture of a copepod
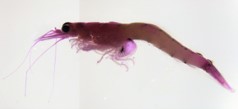
Figure 26: picture of a mysid
Average Zooplankton Biomass by Region
Figure 27: mean is represented by a dotted red line
Figure 28: missing data are represented by tan triangles

Figure 29: Graph of total spring zooplankton biomass in San Pablo from 1998 to 2023. Values range from 2.5 to 28.0.

Figure 30: Graph of total spring zooplankton biomass in Suisun from 1975 to 2023. Values range from 2.8 to 41.0.

Figure 31: Graph of total spring zooplankton biomass in the Delta from 1975 to 2023. Values range from 1.4 to 38.4.
For more information see: Barros, A. 2021. Zooplankton Trends in the upper SFE 1974-2018. IEP Newsletter 40(1):5-14.
Fish
Background
- Splittail are a native minnow that spawn on floodplains, so they have high reproduction during high flow years when floodplains are inundated with water. Juvenile splittail are sampled by DWR’s Yolo Bypass Monitoring Program’s rotory screw trap.
- Adult Spring-Run Chinook Salmon return from the ocean during the spring. Populations are calculated by CDFW’s Fisheries Branch based on redd counts, carcass surveys, fish entering hatcheries, and live fish counts.
- Juvenile Winter-Run Chinook salmon out-migrate to the ocean in spring, and are sampled by the USFWS’s Chipps Island Trawl, located at the confluence of the Sacramento and San Joaquin Rivers.
Average Fish Catch Trends by Species
Figure 32: mean is represented by a dotted red line
Figure 33: missing data are represented by tan triangles
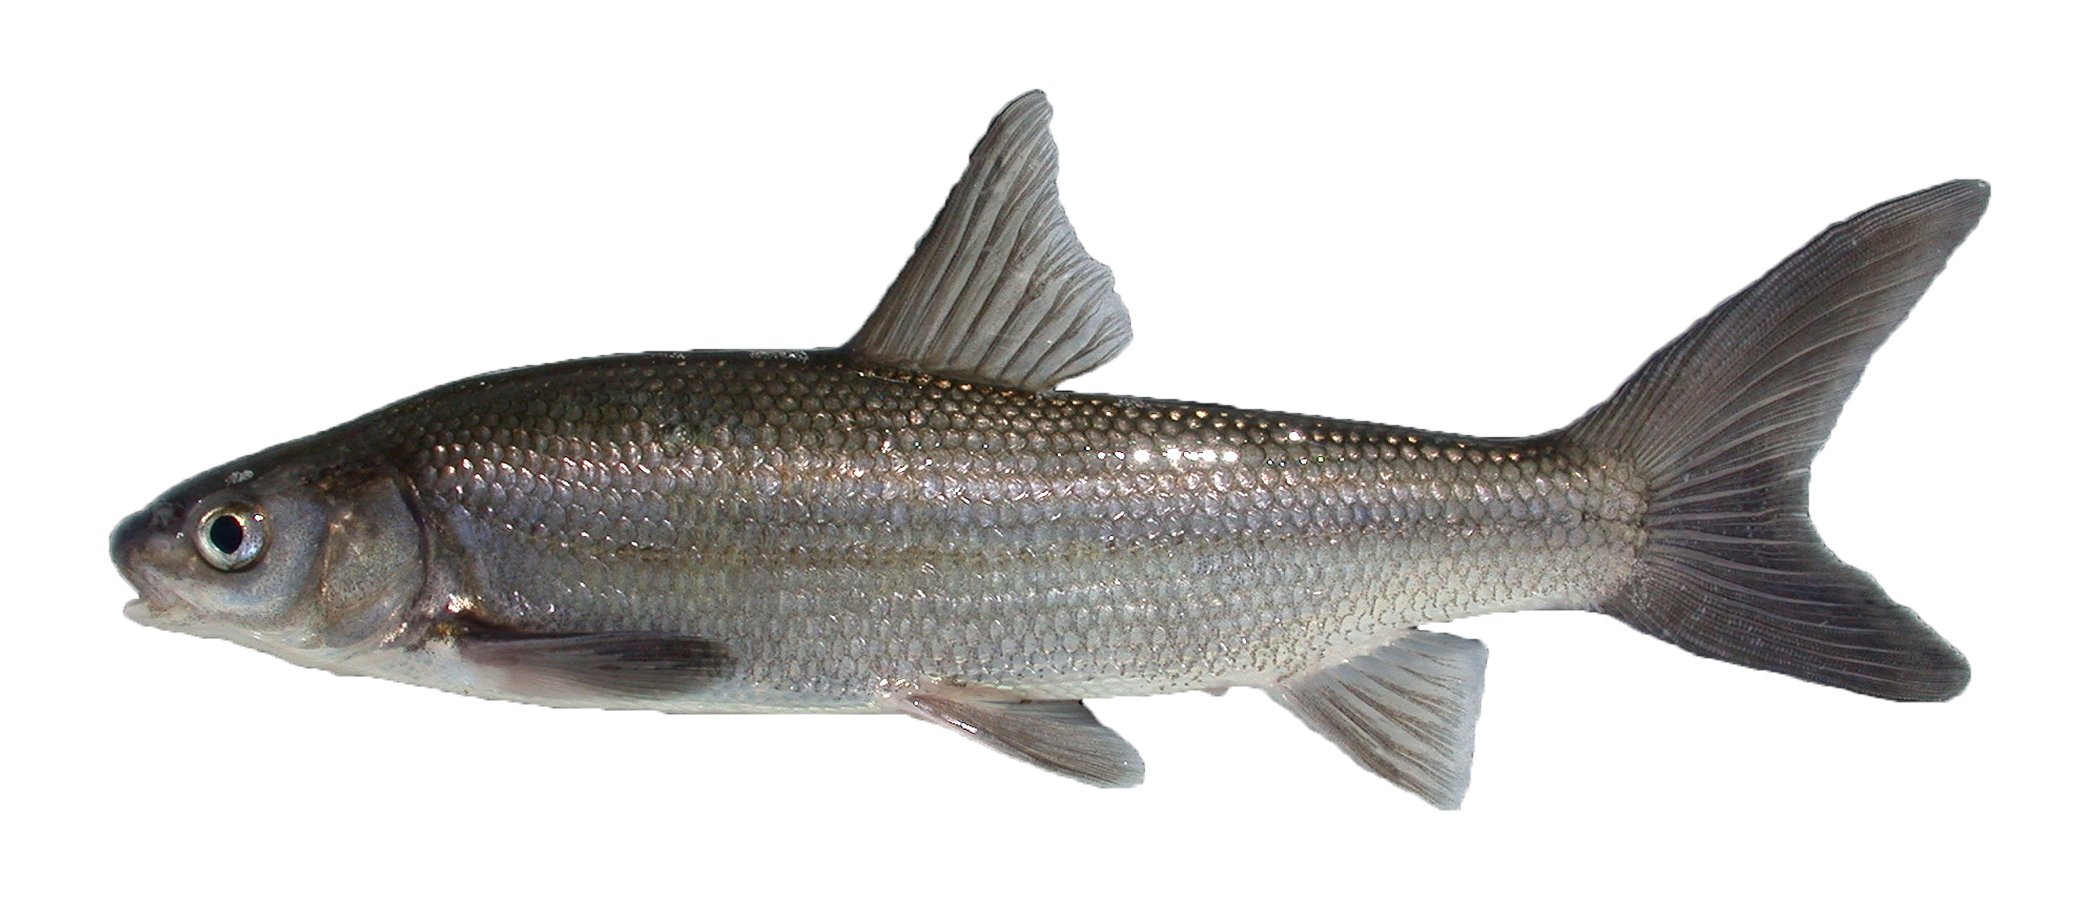
Figure 34: picture of a sacramento splittail
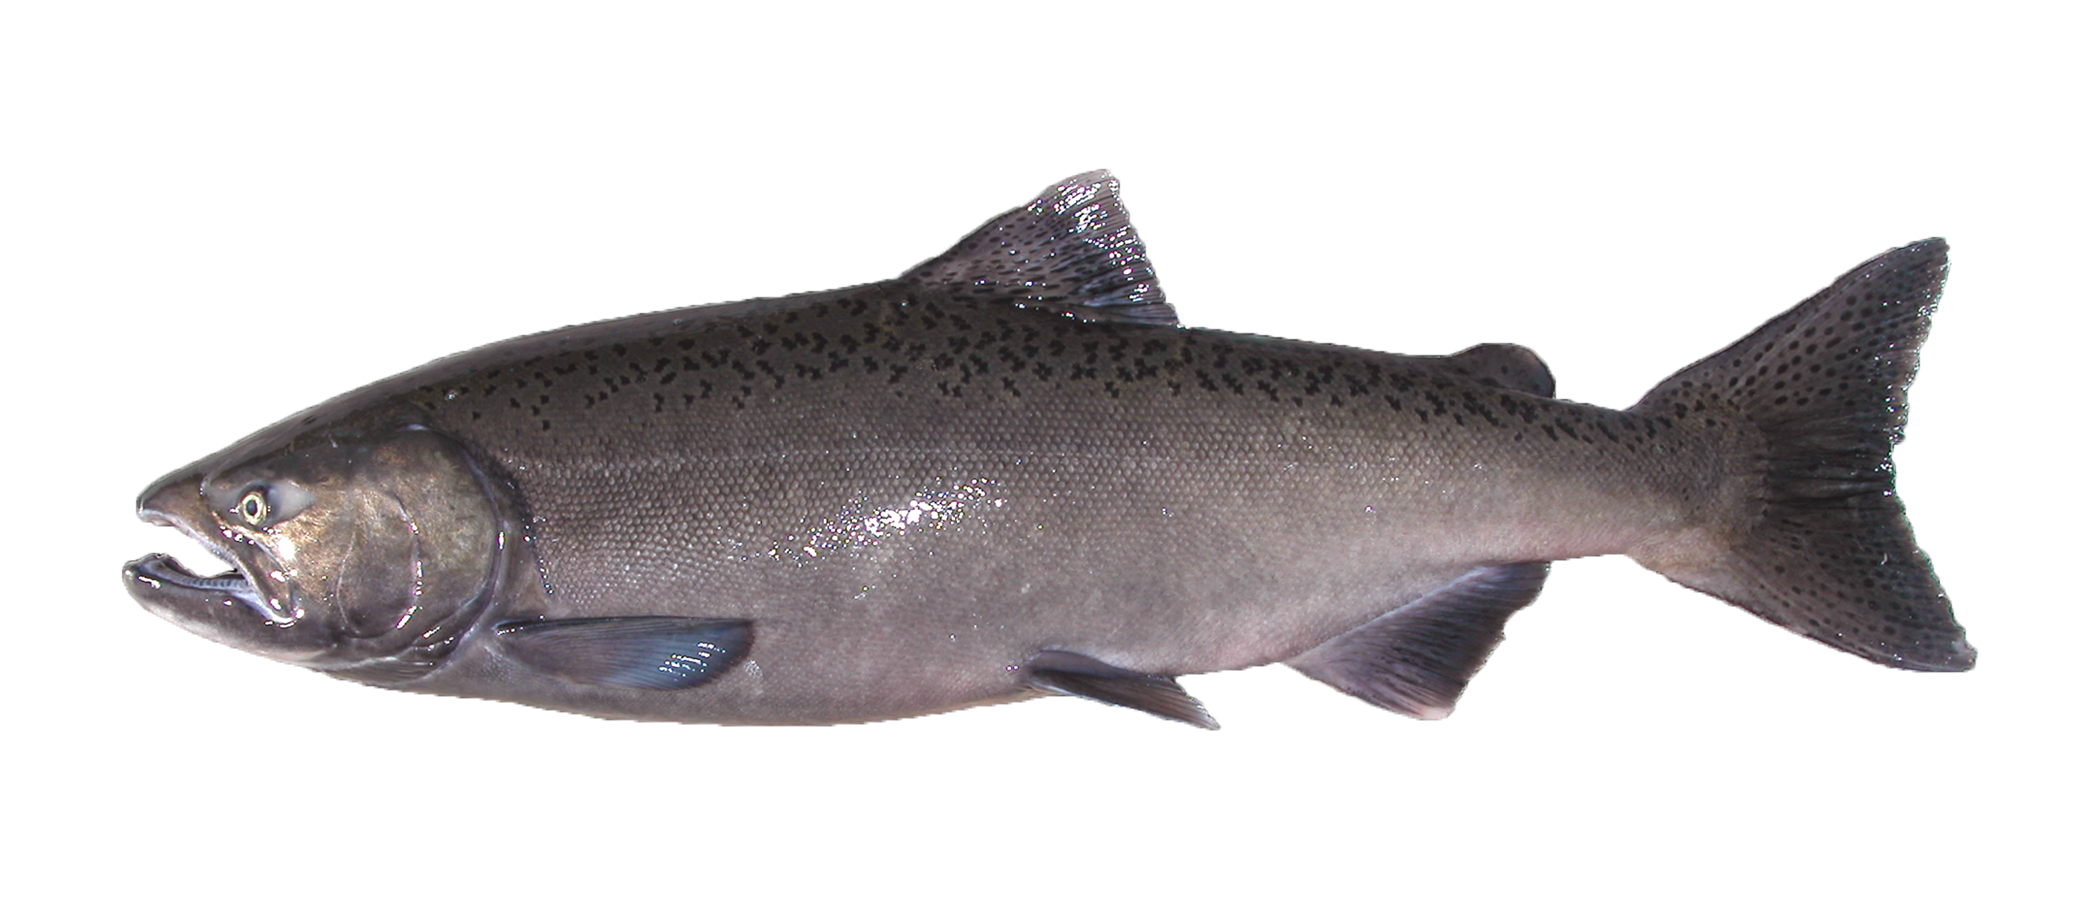
Figure 35: picture of an adult Chinook Salmon
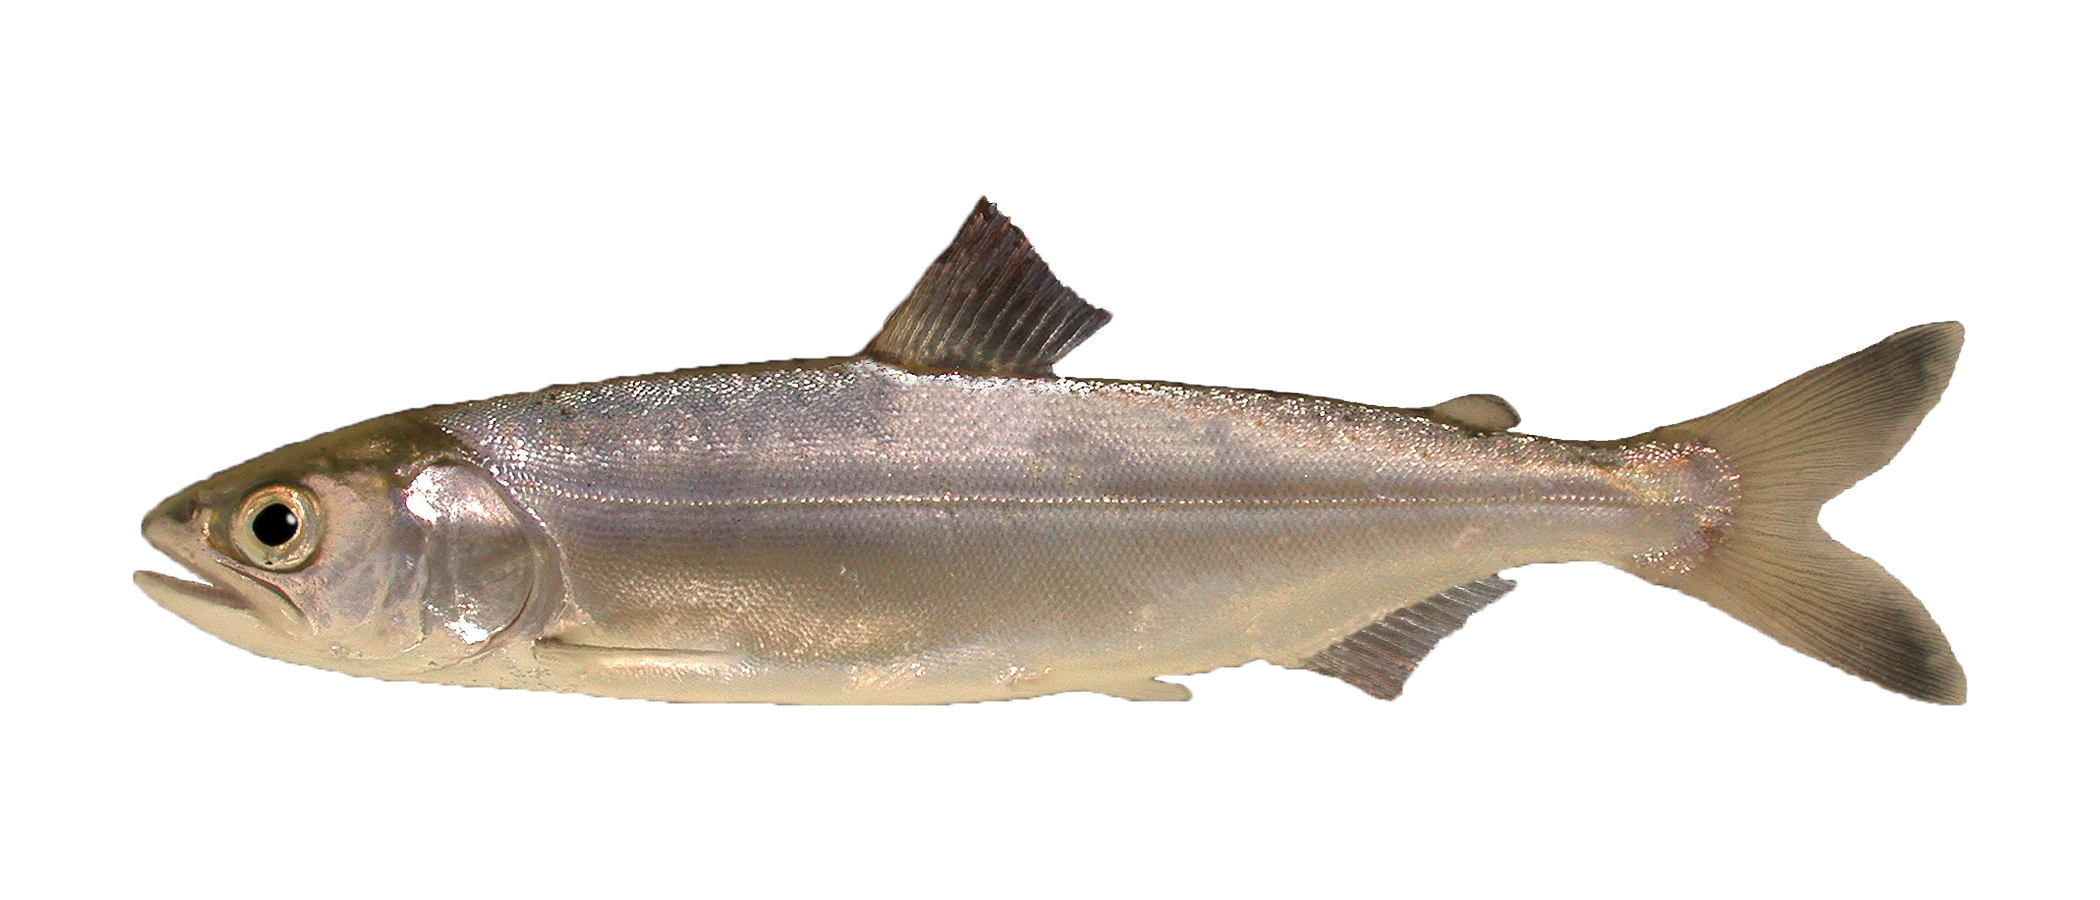
Figure 36: picture of a juvenile salmon

Figure 37: Graph of average Sacramento Splittail catch per unit effort from 1998 to 2023. Values range from 0.0 to 33027.4.

Figure 38: Graph of adult Spring-Run Chinook Salmon returns from 1966 to 2023. Values range from 167.0 to 25980.0.

Figure 39: Graph of juvenile Winter-Run Chinook Salmon index from 1995 to 2024. Values range from 0.1 to 6.0.
For more information see: Kwan, N., H. Hudson, A. Casby, and B. Schreier. 2021. 2018-2019 Yolo Bypass Fisheries Monitoring Status and Trends Report. IEP Newsletter 40(2):35-45.
Recent Trends
Background
- Delta Smelt and Longfin Smelt have been in decline since the early 2000s. The CDFW 20mm Survey was designed to sample post-larval and juvenile Delta Smelt, and samples in San Pablo, Suisun, and the Delta.
- Longfin Smelt frequently spawn further downstream than Delta Smelt, so the 20 mm Survey does not cover their entire range, but still provides an indication of population-level trends.
- Juvenile Winter-Run Chinook Salmon out-migrate to the ocean in spring, and are sampled by the USFWS’s Chipps Island Trawl, located at the confluence of the Sacramento and San Joaquin Rivers.
Average Fish Catch Trends by Species
Figure 40: mean is represented by a dotted red line
Figure 41: missing data are represented by tan triangles
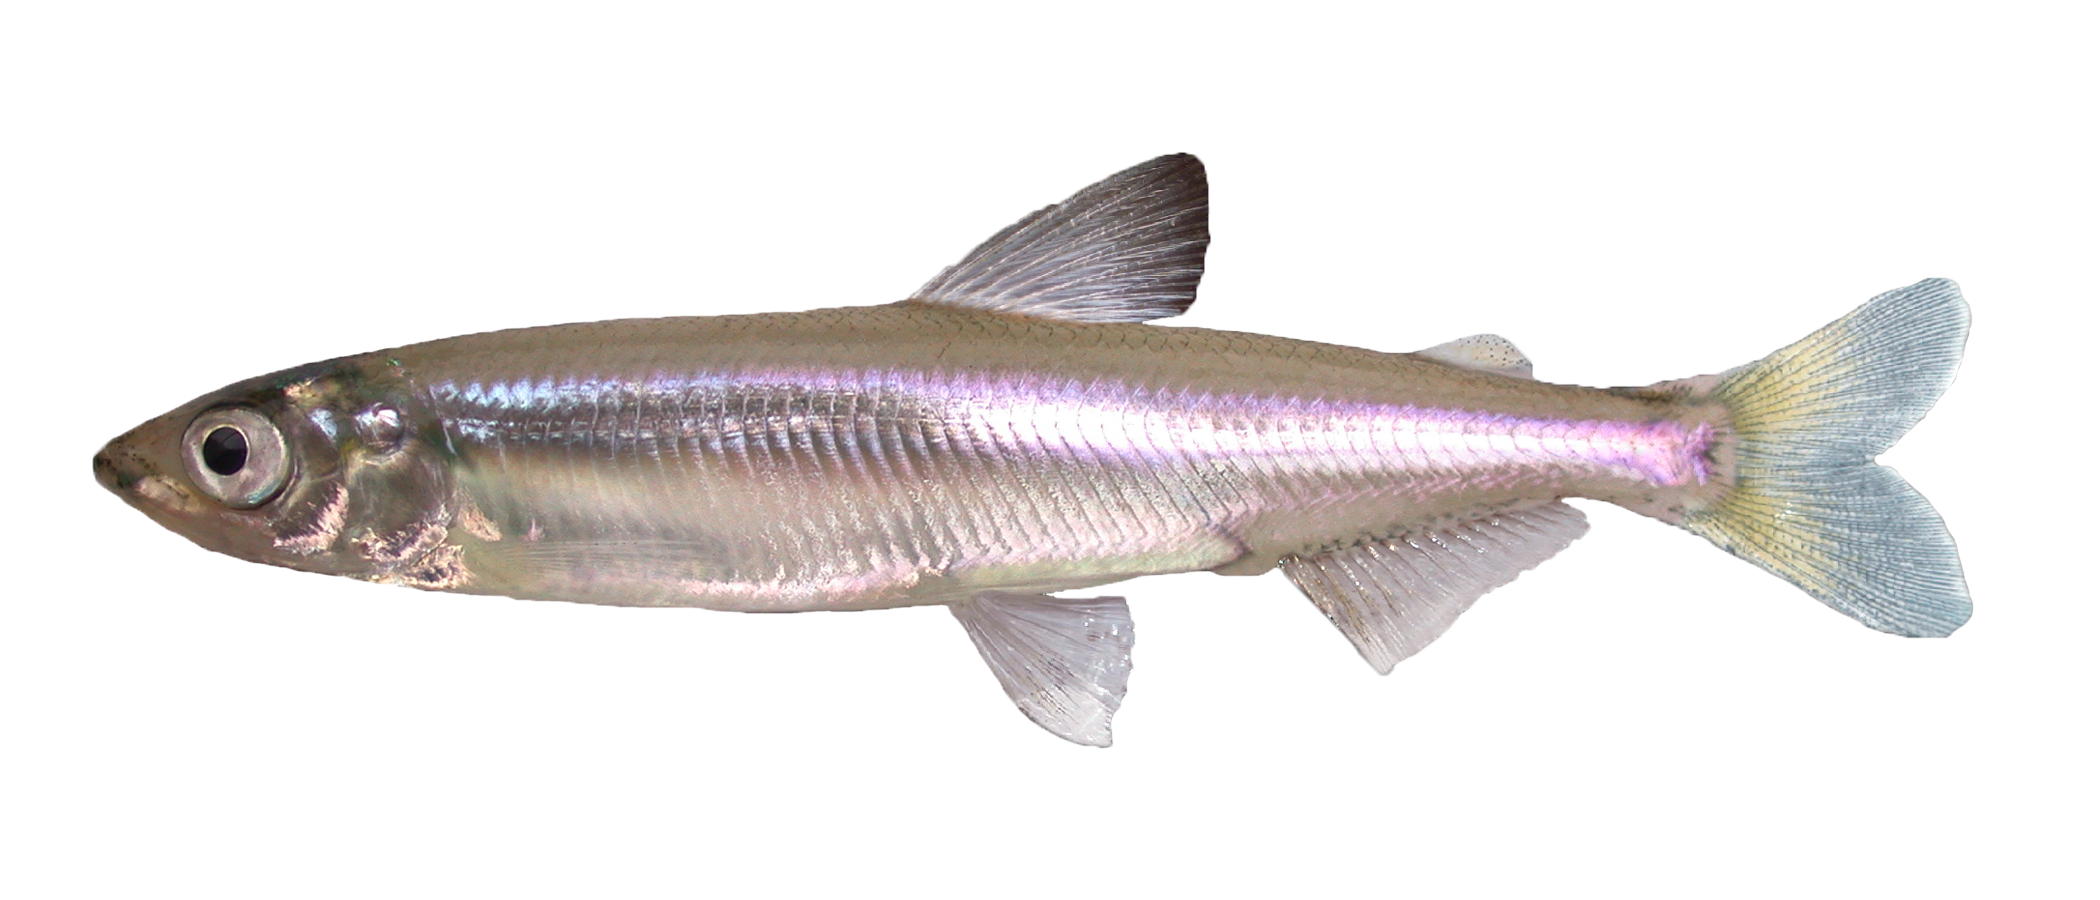
Figure 42: picture of delta smelt
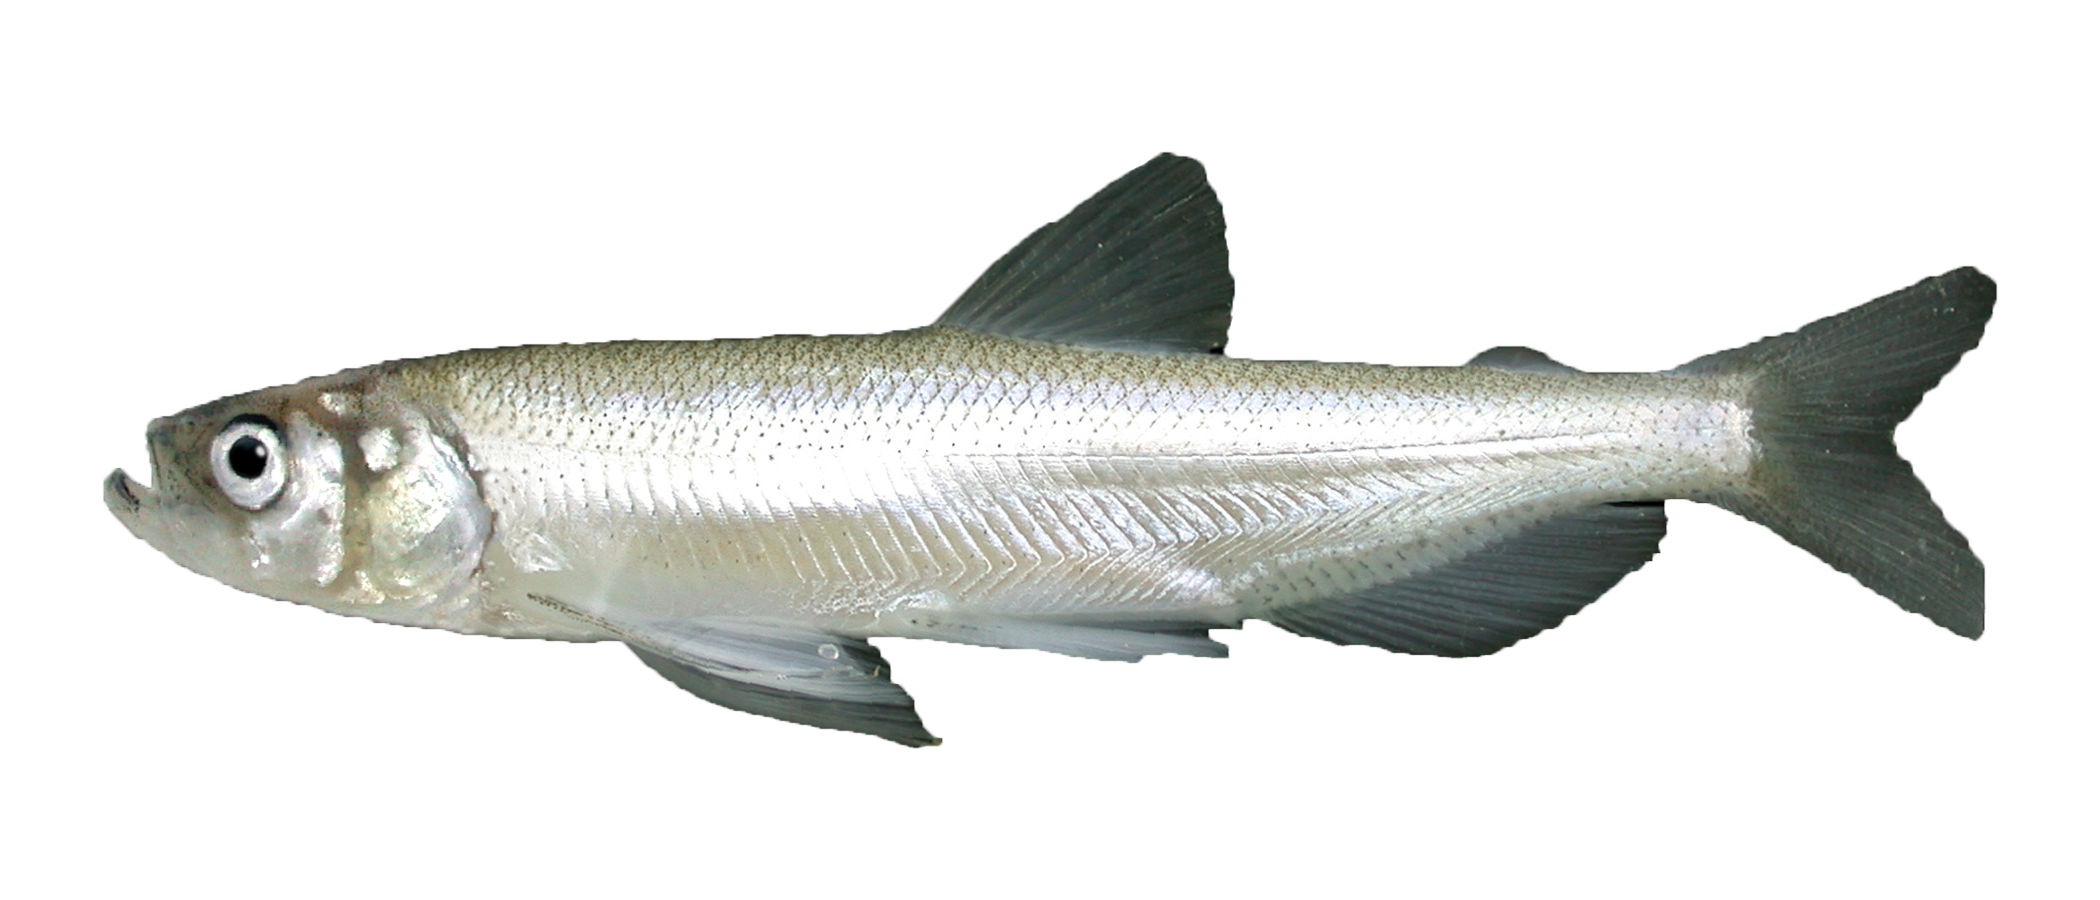
Figure 43: picture of longfin smelt
Figure 44: picture of a juvenile salmon

Figure 45: Graph of post-larval Delta Smelt index from 2004 to 2019. Values range from 0.1 to 6.5.

Figure 46: Graph of Longfin Smelt index from 2004 to 2024. Values range from 3.2 to 140.9.

Figure 47: Graph of juvenile Winter-Run Chinook Salmon index from 2004 to 2024. Values range from 0.1 to 6.0.
For more information see: Johnson, R., S. Windell, P. L. Brandes, J. L. Conrad, J. Ferguson, P. A. L. Goertler, B. N. Harvey, J. Heublein, J. A. Israel, D. W. Kratville, J. E. Kirsch, R. W. Perry, J. Pisciooto, W. R. Poytress, K. Reece, and B. G. Swart. 2017. Science Advancements Key to Increasing Management Value of Life Stage Monitoring Networks for Endangered Sacramento River Winter-Run Chinook Salmon in California. San Francisco Estuary and Watershed Science 15(3). https://escholarship.org/uc/item/6751j957