Winter Report
This report shows trends in water quality, plankton, and fish across multiple IEP surveys for December through February of 1966 to 2024. The winter of 2024 includes December of 2023, and January and February of 2024.
Delta Outflow
- Freshwater flow influences water quality, plankton, and fish populations.
- Winter flow is driven primarily by rainfall and upstream dam releases.
- The long-term average is 45.4.

Figure 140: mean is represented by a dotted red line

Figure 141: Graph of net Delta outflow from 1966 to 2023. Values range from 4.5 to 156.4.
Secchi Depth
Background
- Organisms in this ecosystem are adapted to high turbidity conditions, and reductions in turbidity can have many negative ecological effects.
- Higher values for Secchi depth indicate lower turbidity.
- Secchi depth is measured monthly by DWR’s Environmental Monitoring Program by dropping a black-and-white disk in the water until it disappears.
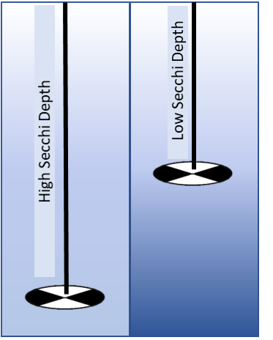
Figure 142: image of a secchi disk
Average Secchi Depth by Region
Figure 143: mean is represented by a dotted red line

Figure 144: missing data are represented by tan triangles

Figure 145: Graph of average winter secchi depth in San Pablo from 1977 to 2024. Values range from 36.0 to 126.0.

Figure 146: Graph of average winter secchi depth in Suisun from 1975 to 2024. Values range from 24.2 to 68.0.

Figure 147: Graph of average winter secchi depth in Delta from 1975 to 2024. Values range from 30.5 to 193.0.
For more information see: Schoellhamer, D. H. 2011. Sudden clearing of estuarine waters upon crossing the threshold from transport to supply regulation of sediment transport as an erodible sediment pool is depleted: San Francisco Bay, 1999. Estuaries and Coasts 34(5):885-899. https://link.springer.com/article/10.1007/s12237-011-9382-x
Water Temperature
Background
- Water temperature is monitored monthly by DWR’s Environmental Monitoring Program.
- Productivity, fish growth, and reproduction is highest in certain temperature ranges.
- Increasing winter temperatures may lower Delta Smelt reproduction and allow invasive aquatic plants to survive the winter.
- Winter temperatures are lower closer to the ocean and slightly higher in the Delta.
Figure 148: picture of a thermometer in water
Average Temperature by Region
Figure 149: mean is represented by a dotted red line
Figure 150: missing data are represented by tan triangles

Figure 151: Graph of average winter water temperature in San Pablo from 1977 to 2024. Values range from 9.1 to 13.9.

Figure 152: Graph of average winter water temperature in Suisun from 1975 to 2024. Values range from 8.5 to 13.1.

Figure 153: Graph of average winter water temperature in Delta from 1975 to 2024. Values range from 8.2 to 12.2.
For more information see: Bashevkin, S. M., B. Mahardja, and L. R. Brown. 2022. Warming in the upper San Francisco Estuary: Patterns of water temperature change from 5 decades of data. Limnology & Oceanography. doi: https://doi.org/10.1002/lno.12057
Chlorophyll
Background
- Chlorophyll is an indicator of phytoplankton production, which is low during the winter.
- Phytoplankton are the base of the pelagic food web. It is sampled monthly by DWR’s Environmental Monitoring Program.
- The invasion of the clam Potamocorbula amurensis caused a decline in phytoplankton and zooplankton after 1986 – especially in Suisun Bay.
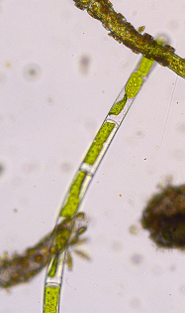
Figure 154: picture of phytoplankton
Average Chlorophyll by Region
Figure 155: mean is represented by a dotted red line
Figure 156: missing data are represented by tan triangles

Figure 157: Graph of average winter chlorophyll in San Pablo from 1977 to 2024. Values range from 0.6 to 8.1.

Figure 158: Graph of average winter chlorophyll in Suisun from 1975 to 2024. Values range from 0.5 to 8.2.

Figure 159: Graph of average winter chlorophyll in Delta from 1975 to 2024. Values range from 1.0 to 6.0.
For more information see: Brown, T. 2021. 2019 Phytoplankton Annual Report. IEP Newsletter 40(2):47-52.
Zooplankton
Background
- Zooplankton is sampled monthly by the CDFW/DWR Environmental Monitoring Program but sampling during the winter did not begin until 1995.
- Zooplankton are an important food source for pelagic fish.
- Calanoid copepods and mysids are particularly good fish food. Cyclopoid copepods are not as good for fish food.
- Biomass in winter tends to be the lowest of the year.
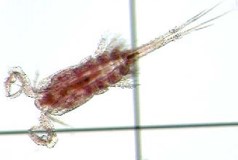
Figure 160: picture of a copepod
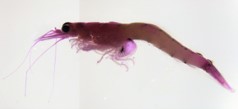
Figure 161: picture of a mysid
Average Zooplankton Biomass by Region
Figure 162: mean is represented by a dotted red line
Figure 163: missing data are represented by tan triangles

Figure 164: Graph of total winter zooplankton biomass in San Pablo from 1998 to 2024. Values range from 0.1 to 14.6.

Figure 165: Graph of total winter zooplankton biomass in Suisun from 1995 to 2024. Values range from 0.9 to 6.5.

Figure 166: Graph of total winter zooplankton biomass in the Delta from 1995 to 2024. Values range from 0.5 to 4.0.
For more information see: Barros, A. 2021. Zooplankton Trends in the upper SFE 1974-2018. IEP Newsletter 40(1):5-14.
Fish
Background
- White sturgeon support a recreational fishery. Juvenile sturgeon are sampled by in the CDFW Bay Study, which samples throughout the San Francisco Bay, Suisun Bay, and the Delta.
- Longfin Smelt are listed as Threatened under the California Endangered Species Act. Spawning adults are sampled in winter by the CDFW Bay Study midwater trawl.
- Juvenile Winter-Run Chinook Salmon are sampled by the USFWS’s Chipps Island Trawl, located at the confluence of the Sacramento and San Joaquin Rivers.
Average Fish Catch Trends by Species
Figure 167: mean is represented by a dotted red line
Figure 168: missing data are represented by tan triangles
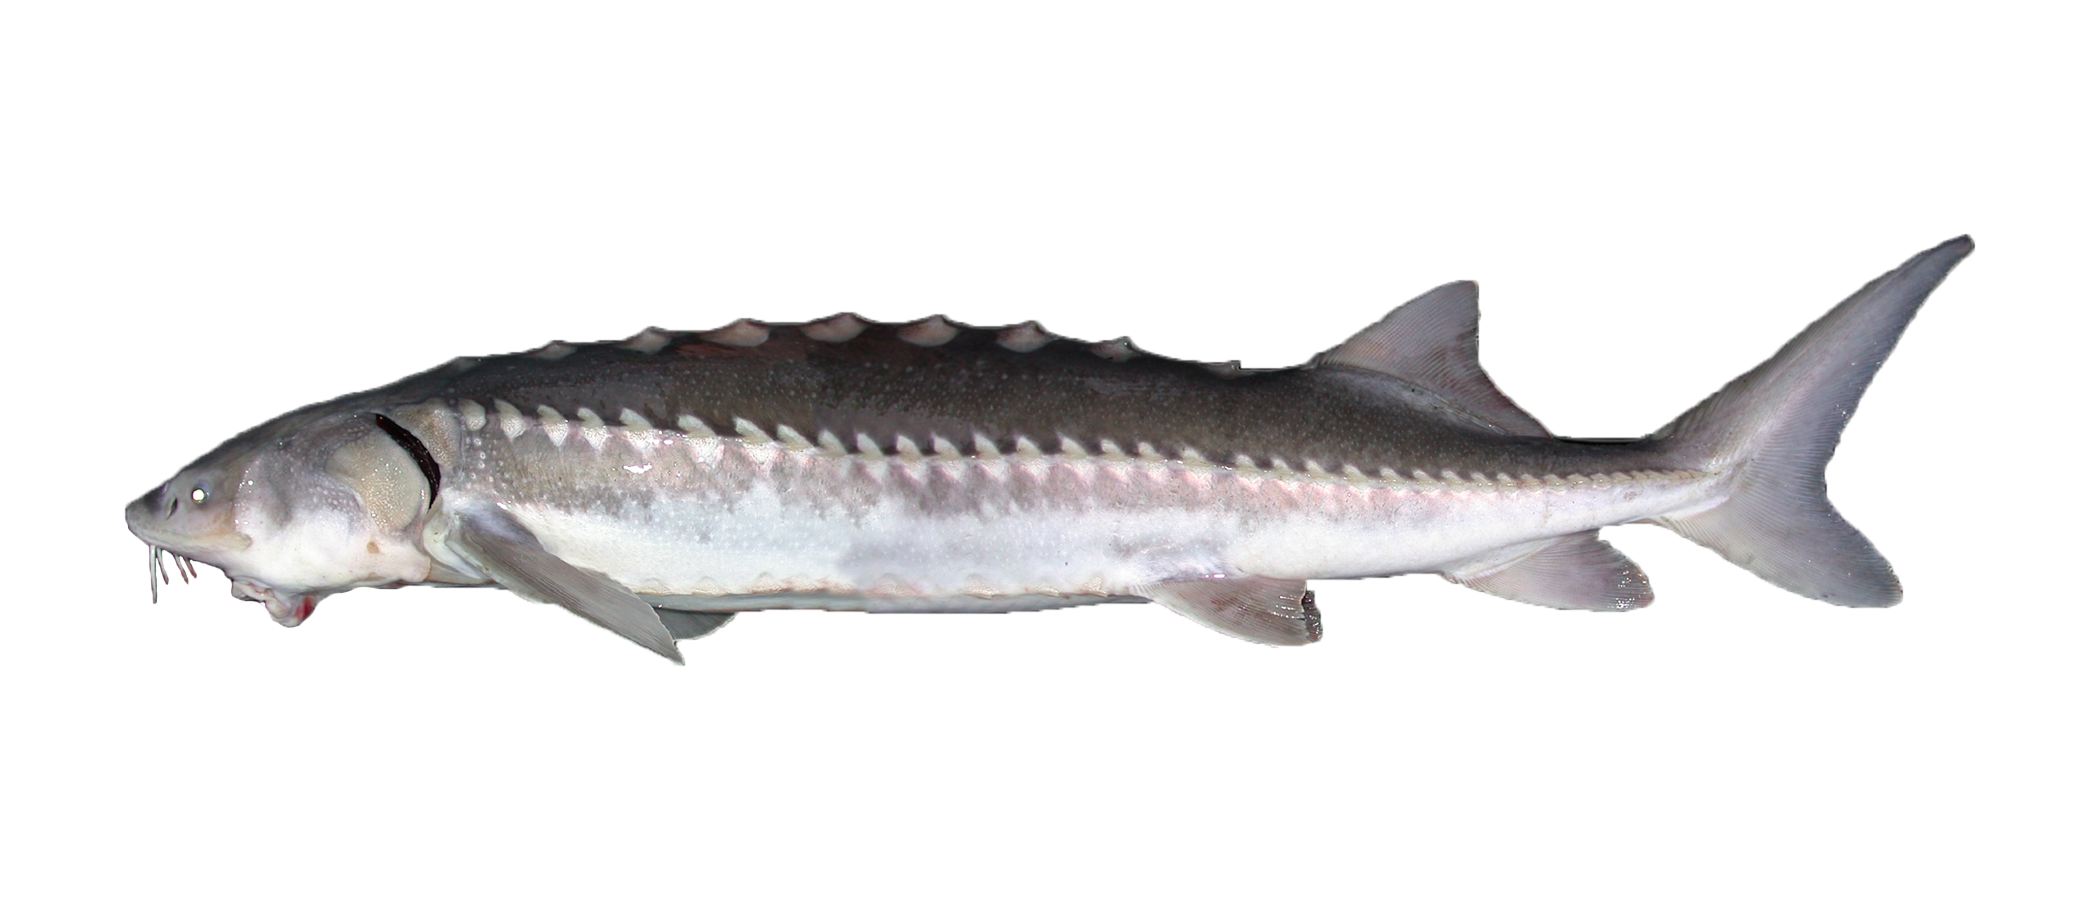
Figure 169: picture of a white sturgeon
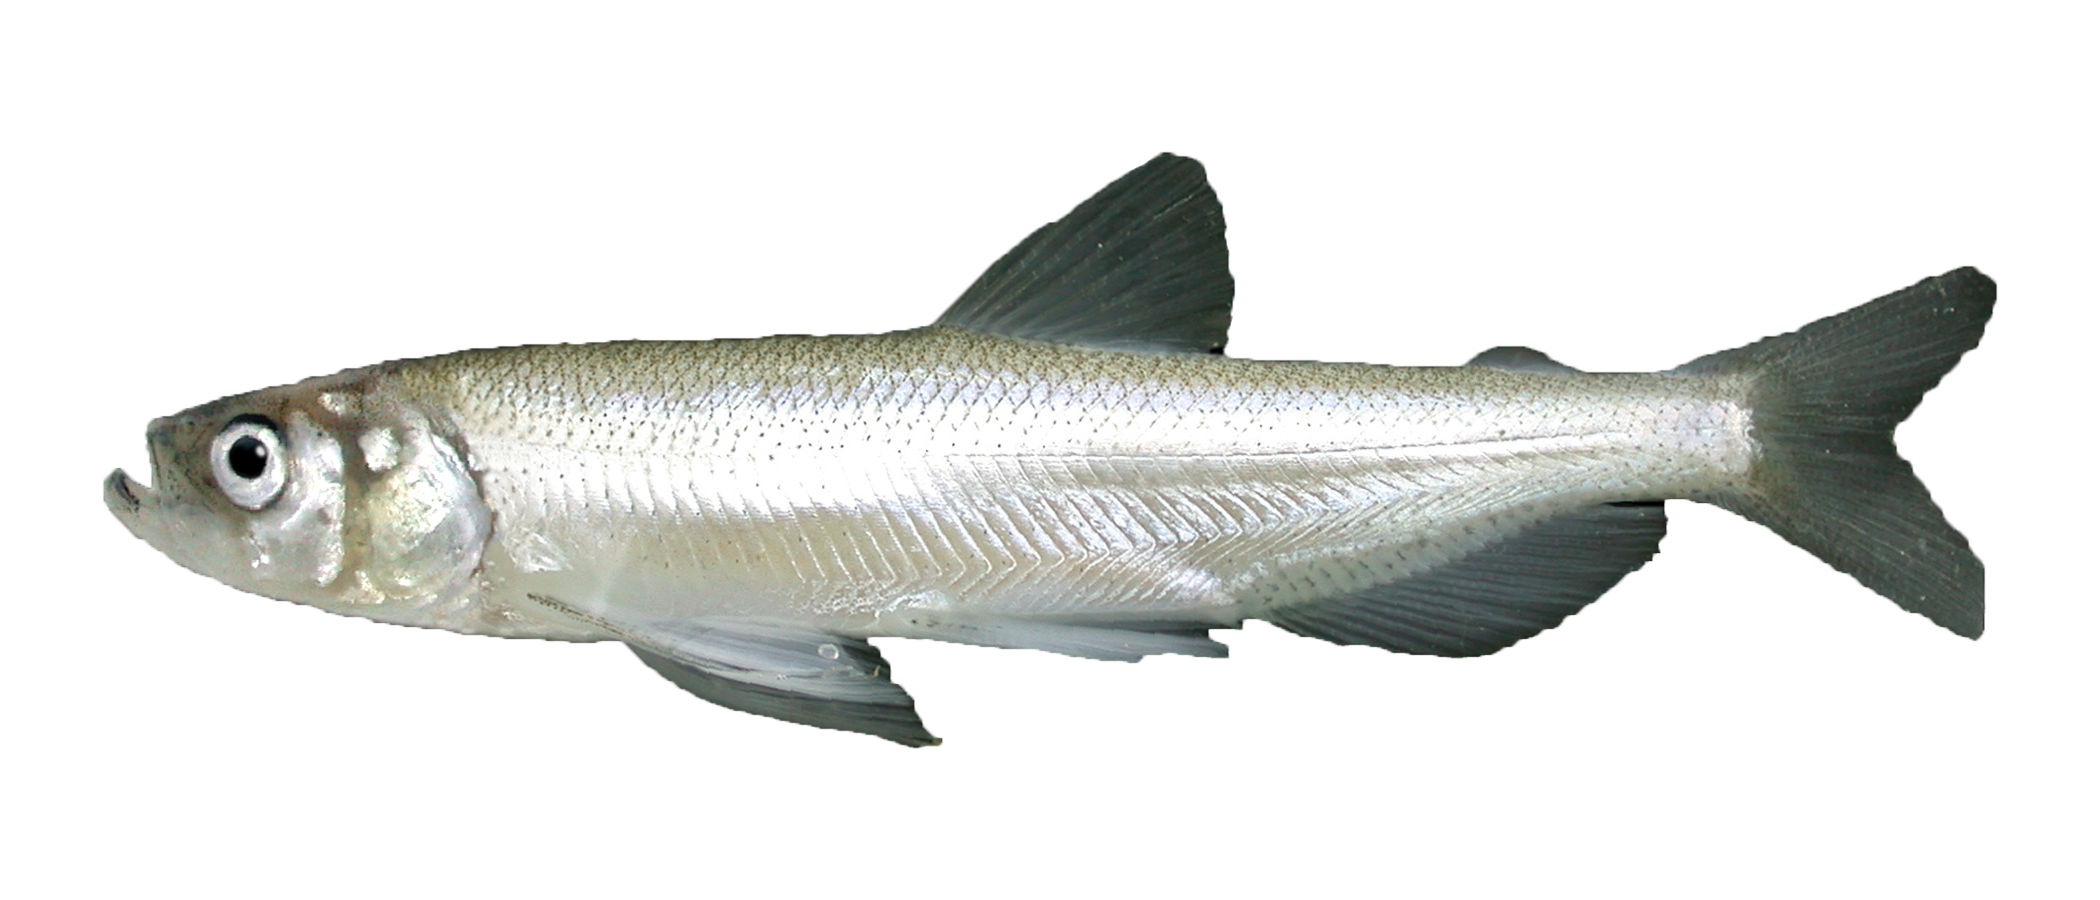
Figure 170: picture of a Longfin Smelt
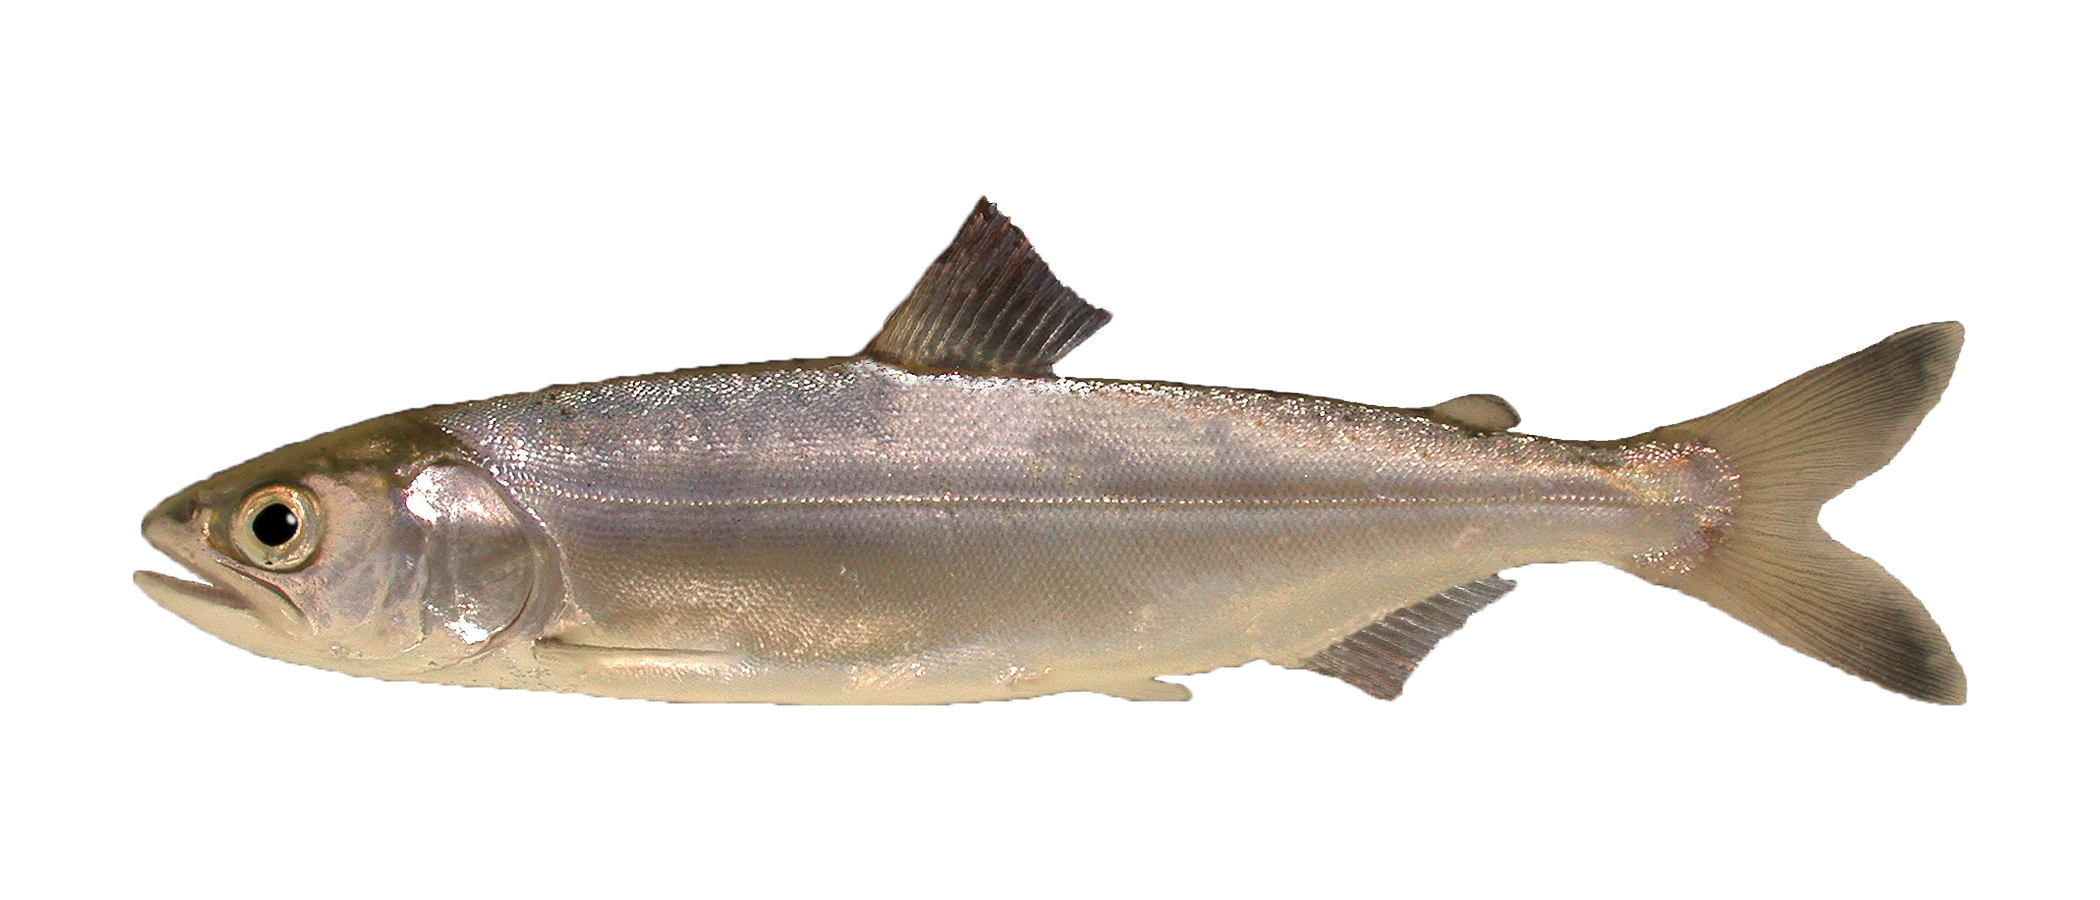
Figure 171: picture of a juvenile Chinook Salmon

Figure 172: Graph of white sturgeon year-class index from 1980 to 2020. Values range from 0.0 to 720.0.

Figure 173: Graph of Longfin Smelt index from 1980 to 2023. Values range from 0.0 to 93.4.

Figure 174: Graph of juvenile winter-run Chinook Salmon passage rate from 1995 to 2024. Values range from 0.0 to 1.4.
For more information see: Patton, O., Larwood, V., Young, M., & Feyrer, F. (2020). . 2020. Estuarine Habitat Use by White Sturgeon (Acipenser transmontanus). San Francisco Estuary and Watershed Science 18(4). doi: http://dx.doi.org/10.15447/sfews.2020v18iss4art4
Recent Trends
Background
- Delta Smelt and Longfin Smelt have been in decline since the early 2000s. The CDFW Spring Kodiak Trawl was designed to sample spawning Delta Smelt, and samples in San Pablo, Suisun, and the Delta.
- Longfin Smelt frequently spawn further downstream than Delta Smelt, so are better sampled by the CDFW Bay Study. The Bay Study samples throughout the San Francisco Bay, Suisun Bay, and the Delta.
- Juvenile Chinook pass Red Bluff Diversion Dam on the upper Sacramento as they migrate from spawning grounds to the ocean.
Average Fish Catch Trends by Species
Figure 175: mean is represented by a dotted red line
Figure 176: missing data are represented by tan triangles
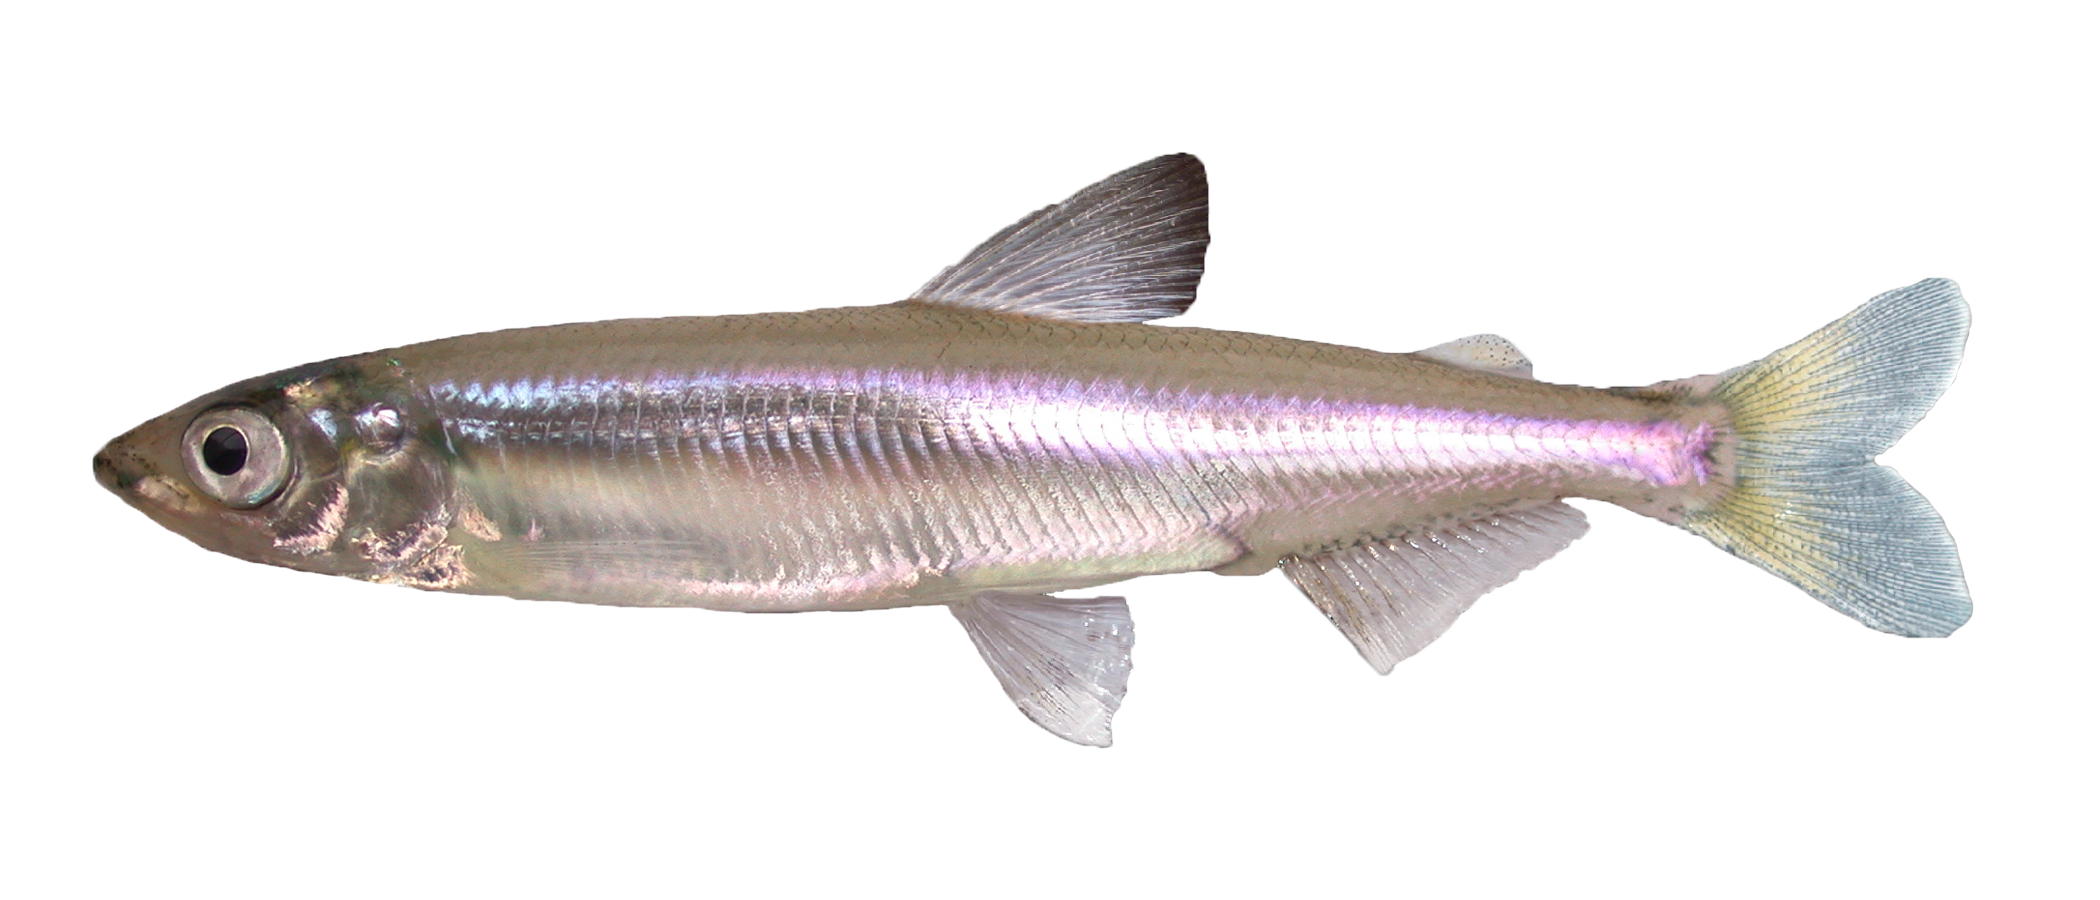
Figure 177: picture of delta smelt
Figure 178: picture of longfin smelt
Figure 179: picture of juvenile Chinnook Salmon

Figure 180: Graph of Delta Smelt index from 2004 to 2021. Values range from 0.0 to 130.2.

Figure 181: Graph of Longfin Smelt index from 2004 to 2023. Values range from 0.0 to 2.4.

Figure 182: Graph of Juvenile Winter-run Chinook Salmon Passage Estimate from 2004 to 2024. Values range from 155.1 to 4152.0.
For more information see: Chorazyczewski, A. 2022. 2021 Spring Kodiak Trawl Summary. IEP Newsletter 40(3):11-15.