Fall Report
This report shows trends in water quality, plankton, and fish across multiple IEP surveys for September through November from 1966 to 2024.
Delta Outflow
- Freshwater flow influences water quality, plankton, and fish populations.
- Fall flow is driven primarily by upstream dam releases and exports.
- The long-term average is 10.0.

Figure 91: mean is represented by a dotted red line

Figure 92: Graph of net Delta outflow from 1966 to 2023. Values range from 2.9 to 45.8.
Secchi Depth
Background
- Organisms in this ecosystem are adapted to high turbidity conditions, and reductions in turbidity can have many negative ecological effects.
- Higher values for Secchi depth indicate lower turbidity.
- Secchi depth is measured monthly by DWR’s Environmental Monitoring Program by dropping a black-and-white disk in the water until it disappears.
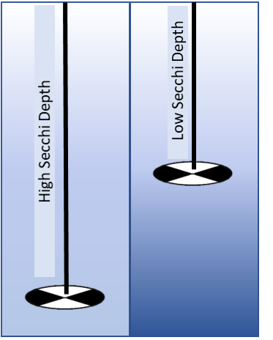
Figure 93: image of a secchi disk
Average Secchi Depth by Region
Figure 94: mean is represented by a dotted red line

Figure 95: missing data are represented by tan triangles

Figure 96: Graph of average fall secchi depth in San Pablo from 1976 to 2023. Values range from 49.6 to 142.0.

Figure 97: Graph of average fall secchi depth in Suisun from 1975 to 2023. Values range from 26.7 to 78.8.

Figure 98: Graph of average fall secchi depth in Delta from 1975 to 2023. Values range from 46.3 to 176.1.
For more information see: Schoellhamer, D. H. 2011. Sudden clearing of estuarine waters upon crossing the threshold from transport to supply regulation of sediment transport as an erodible sediment pool is depleted: San Francisco Bay, 1999. Estuaries and Coasts 34(5):885-899. https://link.springer.com/article/10.1007/s12237-011-9382-x
Water Temperature
Background
- Water temperature is monitored monthly by DWR’s Environmental Monitoring Program.
- Fish growth and reproduction is highest in certain temperature ranges.
- Increasing fall temperatures may lower Delta Smelt reproduction.
- Fall temperatures are lower closer to the ocean and slightly higher in the Delta.
Figure 99: picture of a thermometer in water
Average Temperature by Region
Figure 100: mean is represented by a dotted red line
Figure 101: missing data are represented by tan triangles

Figure 102: Graph of average fall water temperature in San Pablo from 1976 to 2023. Values range from 16.0 to 20.4.

Figure 103: Graph of average fall water temperature in Suisun from 1975 to 2023. Values range from 16.6 to 20.0.

Figure 104: Graph of average fall water temperature in Delta from 1975 to 2023. Values range from 17.2 to 21.1.
For more information see: Bashevkin, S. M., B. Mahardja, and L. R. Brown. 2022. Warming in the upper San Francisco Estuary: Patterns of water temperature change from 5 decades of data. Limnology & Oceanography. doi: https://doi.org/10.1002/lno.12057
Chlorophyll
Background
- Chlorophyll is an indicator of phytoplankton production, which is low during the fall.
- Phytoplankton are the base of the pelagic food web. It is sampled monthly by DWR’s Environmental Monitoring Program.
- The invasion of the clam Potamocorbula amurensis caused a decline in phytoplankton and zooplankton after 1986 – especially in Suisun Bay.
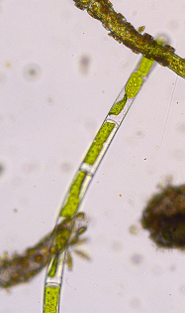
Figure 105: picture of phytoplankton
Average Chlorophyll by Region
Figure 106: mean is represented by a dotted red line
Figure 107: missing data are represented by tan triangles

Figure 108: Graph of average fall chlorophyll in San Pablo from 1976 to 2023. Values range from 1.0 to 5.8.

Figure 109: Graph of average fall chlorophyll in Suisun from 1975 to 2023. Values range from 0.7 to 22.3.

Figure 110: Graph of average fall chlorophyll in Delta from 1975 to 2023. Values range from 1.6 to 21.4.
For more information see: Brown, T. 2021. 2019 Phytoplankton Annual Report. IEP Newsletter 40(2):47-52.
Zooplankton
Background
- Zooplankton is sampled monthly by the CDFW/DWR Environmental Monitoring Program but sampling in San Pablo Bay did not begin until 1998.
- Zooplankton are an important food source for pelagic fish.
- Calanoid copepods and mysids are particularly good fish food. Cyclopoid copepods are not as good for fish food.
- Biomass in fall tends to be higher than winter, but lower than summer.
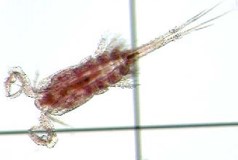
Figure 111: picture of a copepod
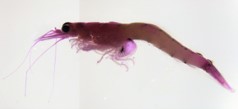
Figure 112: picture of a mysid
Average Zooplankton Biomass by Region
Figure 113: mean is represented by a dotted red line
Figure 114: missing data are represented by tan triangles

Figure 115: Graph of total fall zooplankton biomass in San Pablo from 1998 to 2023. Values range from 1.8 to 14.2.

Figure 116: Graph of total fall zooplankton biomass in Suisun from 1975 to 2023. Values range from 1.5 to 28.7.

Figure 117: Graph of total fall zooplankton biomass in the Delta from 1975 to 2023. Values range from 2.2 to 23.4.
For more information see: Barros, A. 2021. Zooplankton Trends in the upper SFE 1974-2018. IEP Newsletter 40(1):5-14.
Fish
Background
- The Fall Midwater Trawl (FMWT) Survey began in 1967 and surveys the pelagic, or open water, fish community. Indices for many pelagic fishes are at record lows, including Delta and Longfin Smelt, which are protected by California and/or federal Endangered Species Acts.
- White Sturgeon is a species of concern and a popular target of recreational fishing. Catch per unit effort is based on trammel net surveys.
- Fall-Run Chinook Salmon, an important species for both the commercial and recreational fishery, is also a species of concern. Population dynamics are driven by hatchery production and a suite of environmental variables. Totals counts of both in-river and hatchery returns are shown here.
Average Fish Catch Trends by Species
Figure 118: mean is represented by a dotted red line
Figure 119: missing data are represented by tan triangles
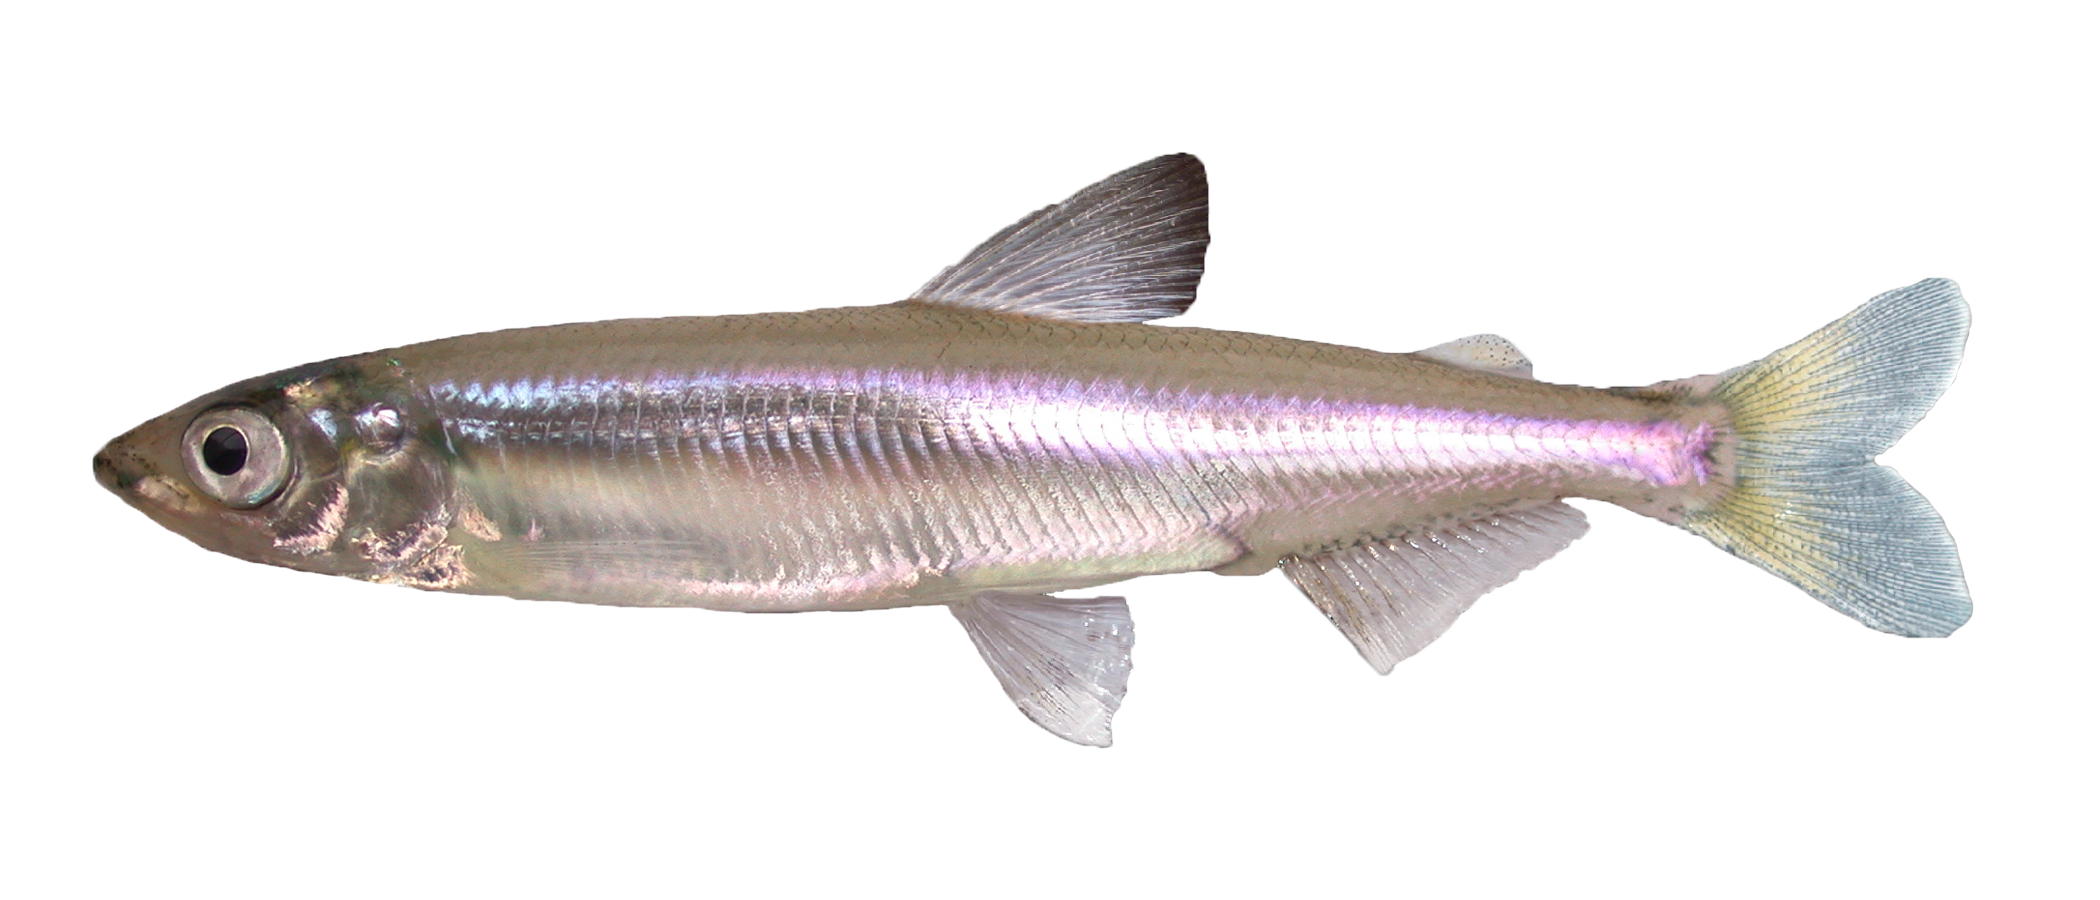
Figure 120: picture of a Delta Smelt
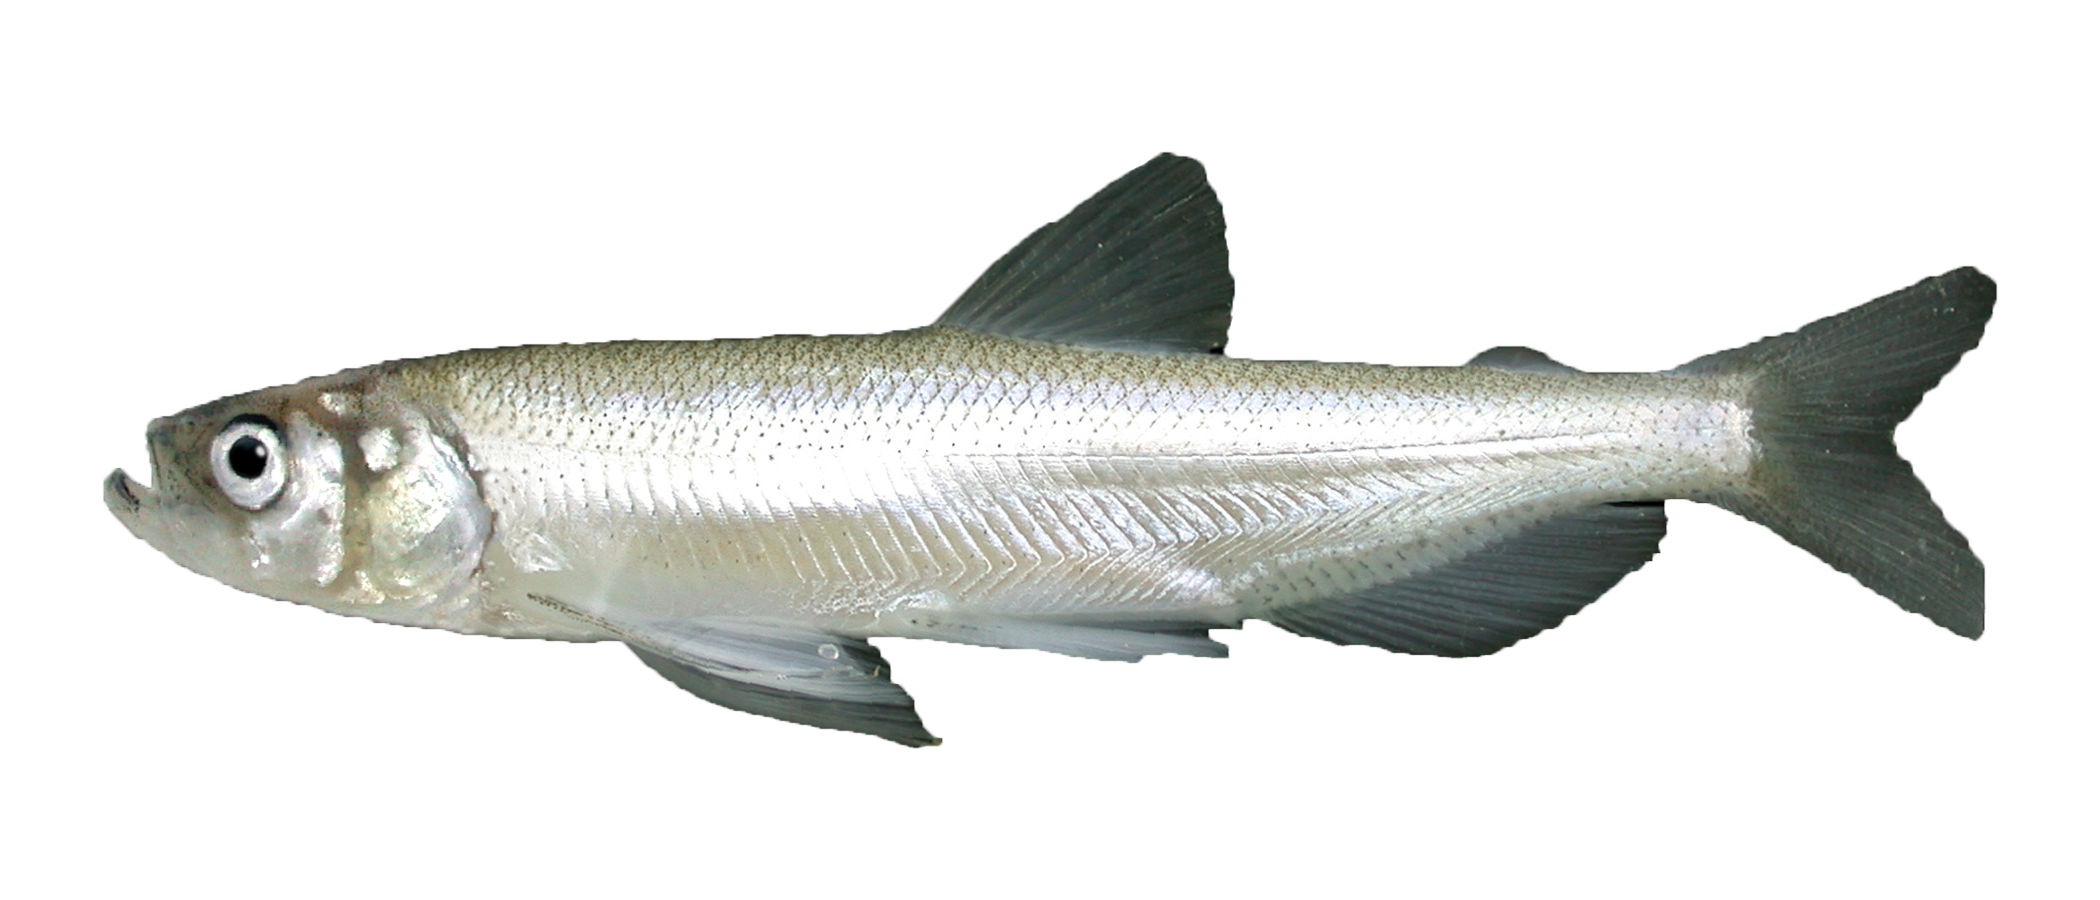
Figure 121: picture of a longfin smelt
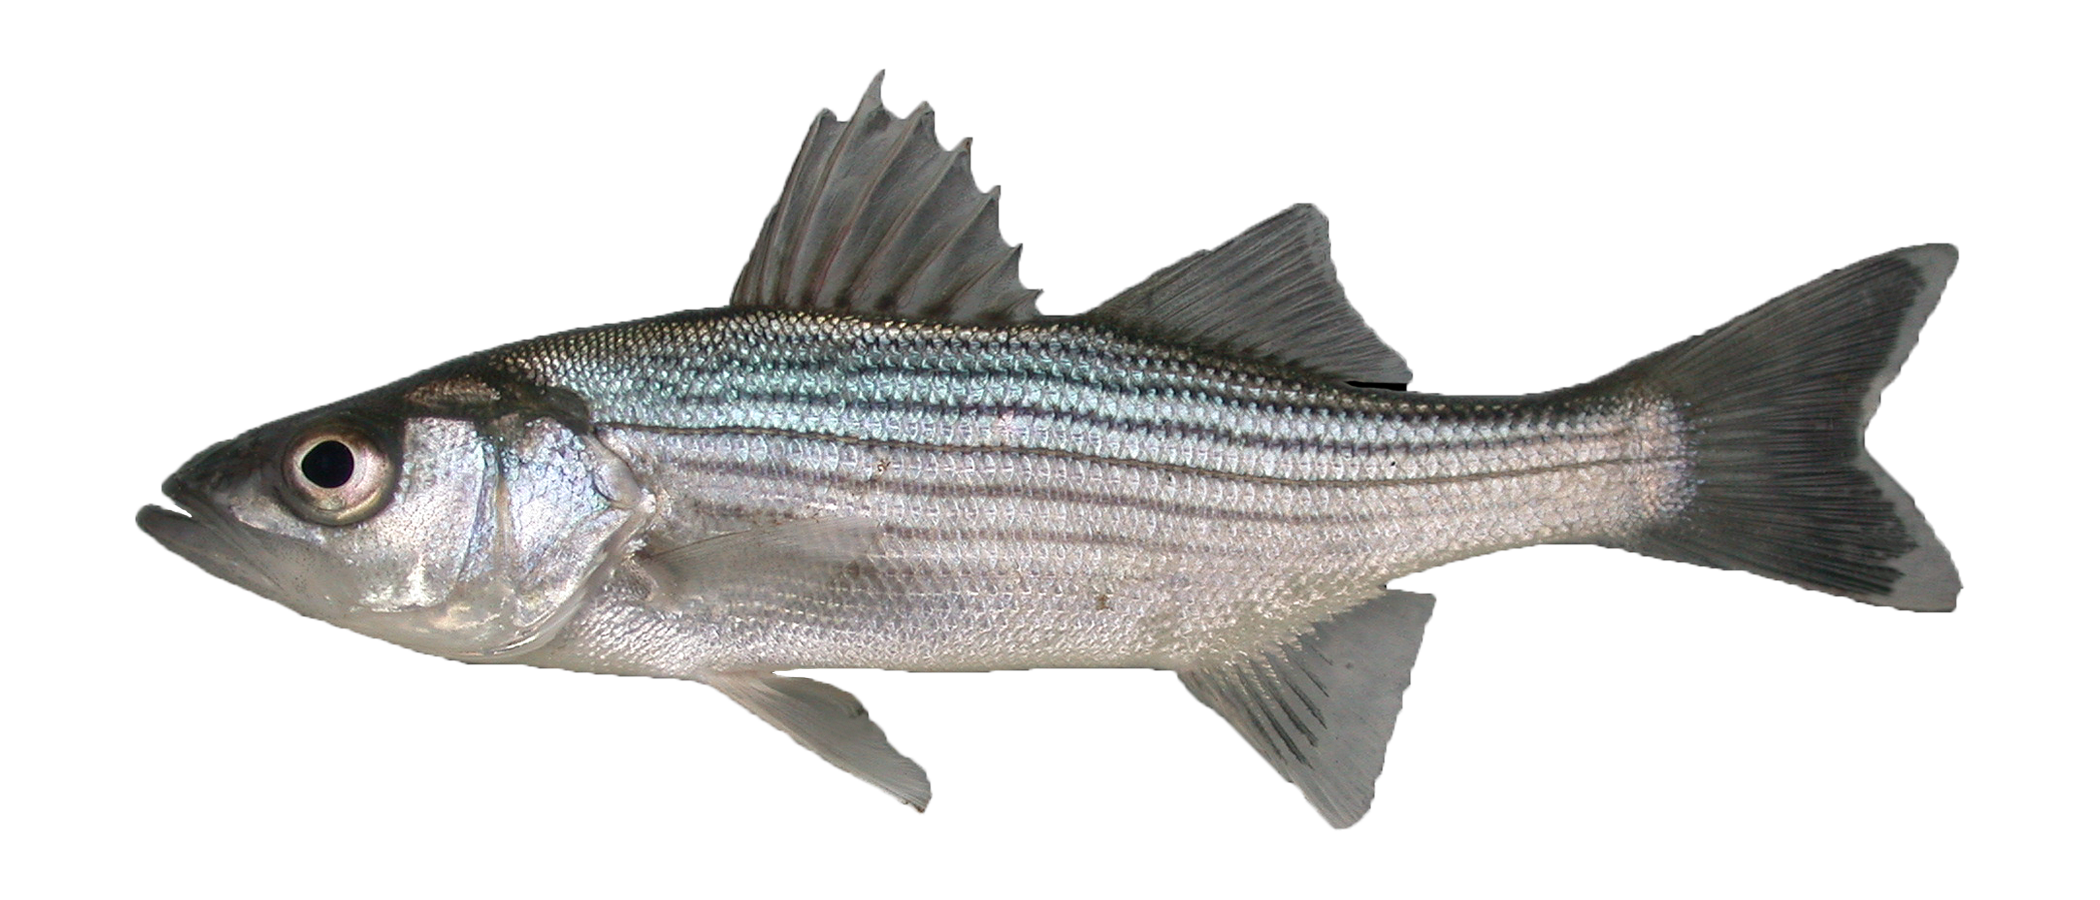
Figure 122: picture of a striped bass

Figure 123: Graph of Delta Smelt index from 1967 to 2023. Values range from 0.0 to 1673.0.

Figure 124: Graph of Longfin Smelt index from 1967 to 2023. Values range from 4.0 to 81737.0.

Figure 125: Graph of young-of-the-year striped bass index from 1967 to 2023. Values range from 42.0 to 19677.0.
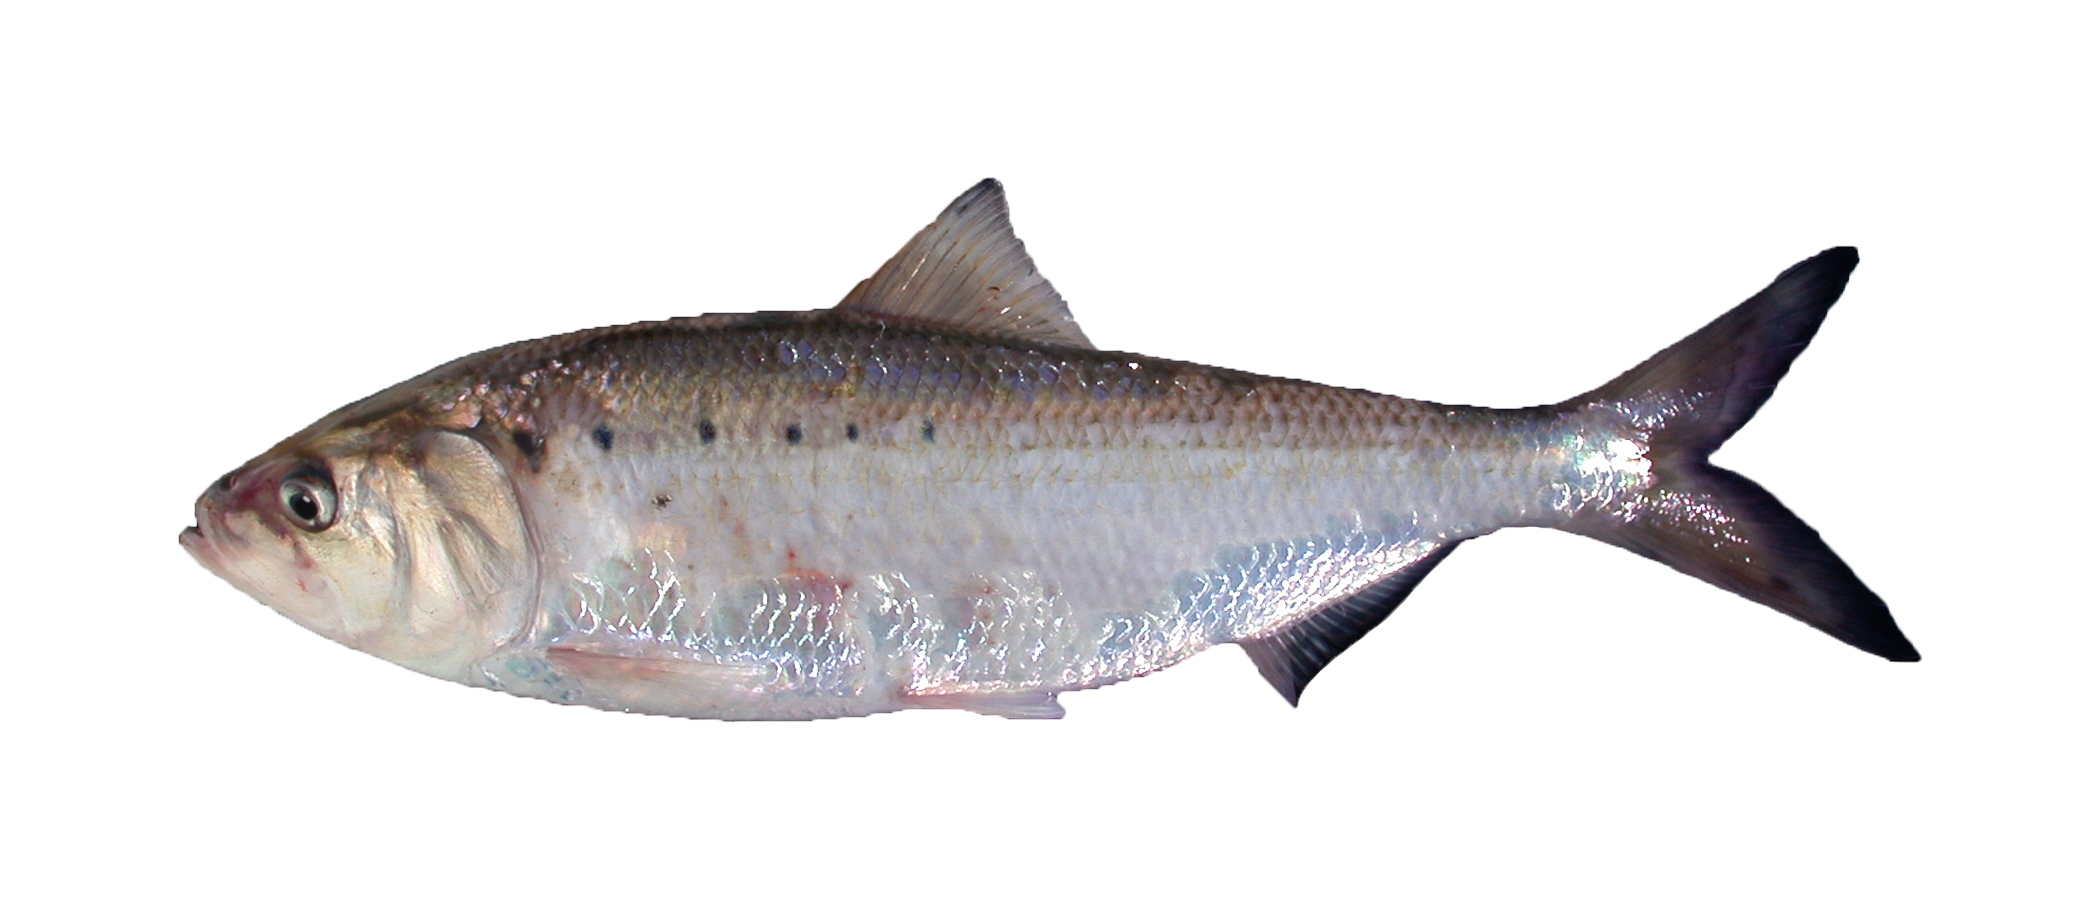
Figure 126: picture of an American Shad
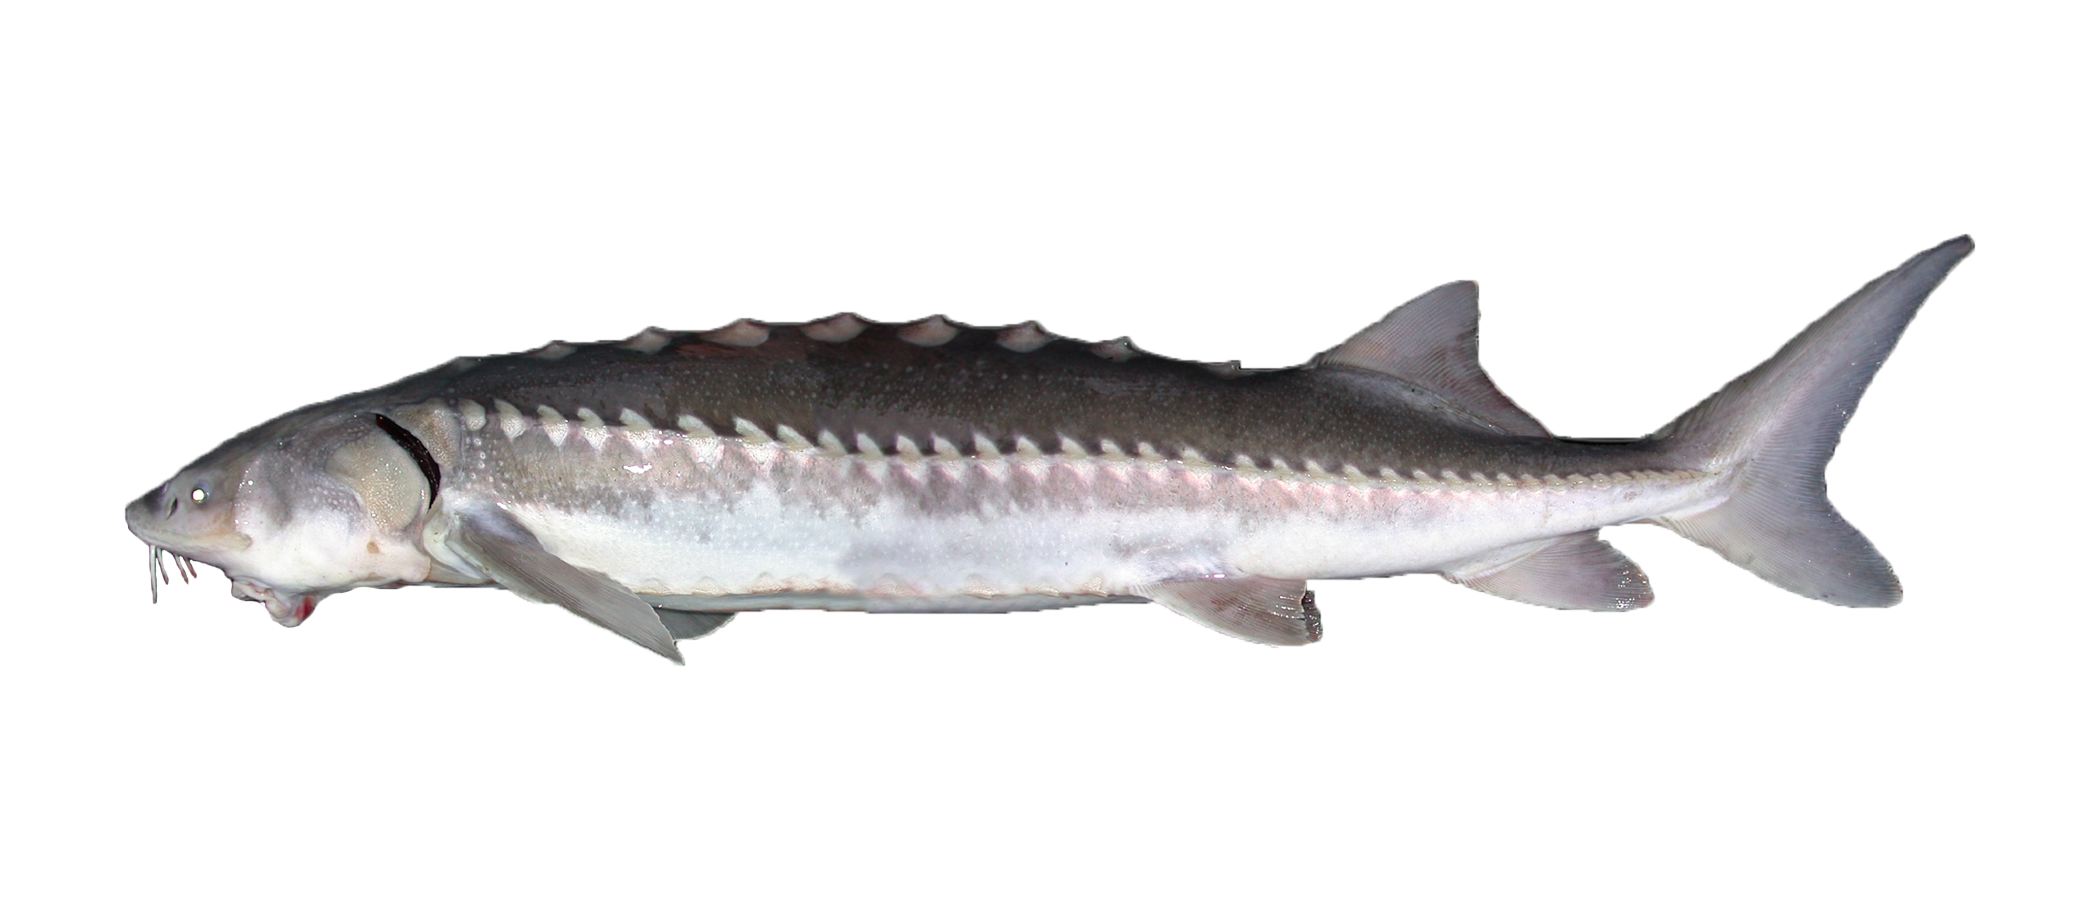
Figure 127: picture of a White Sturgeon
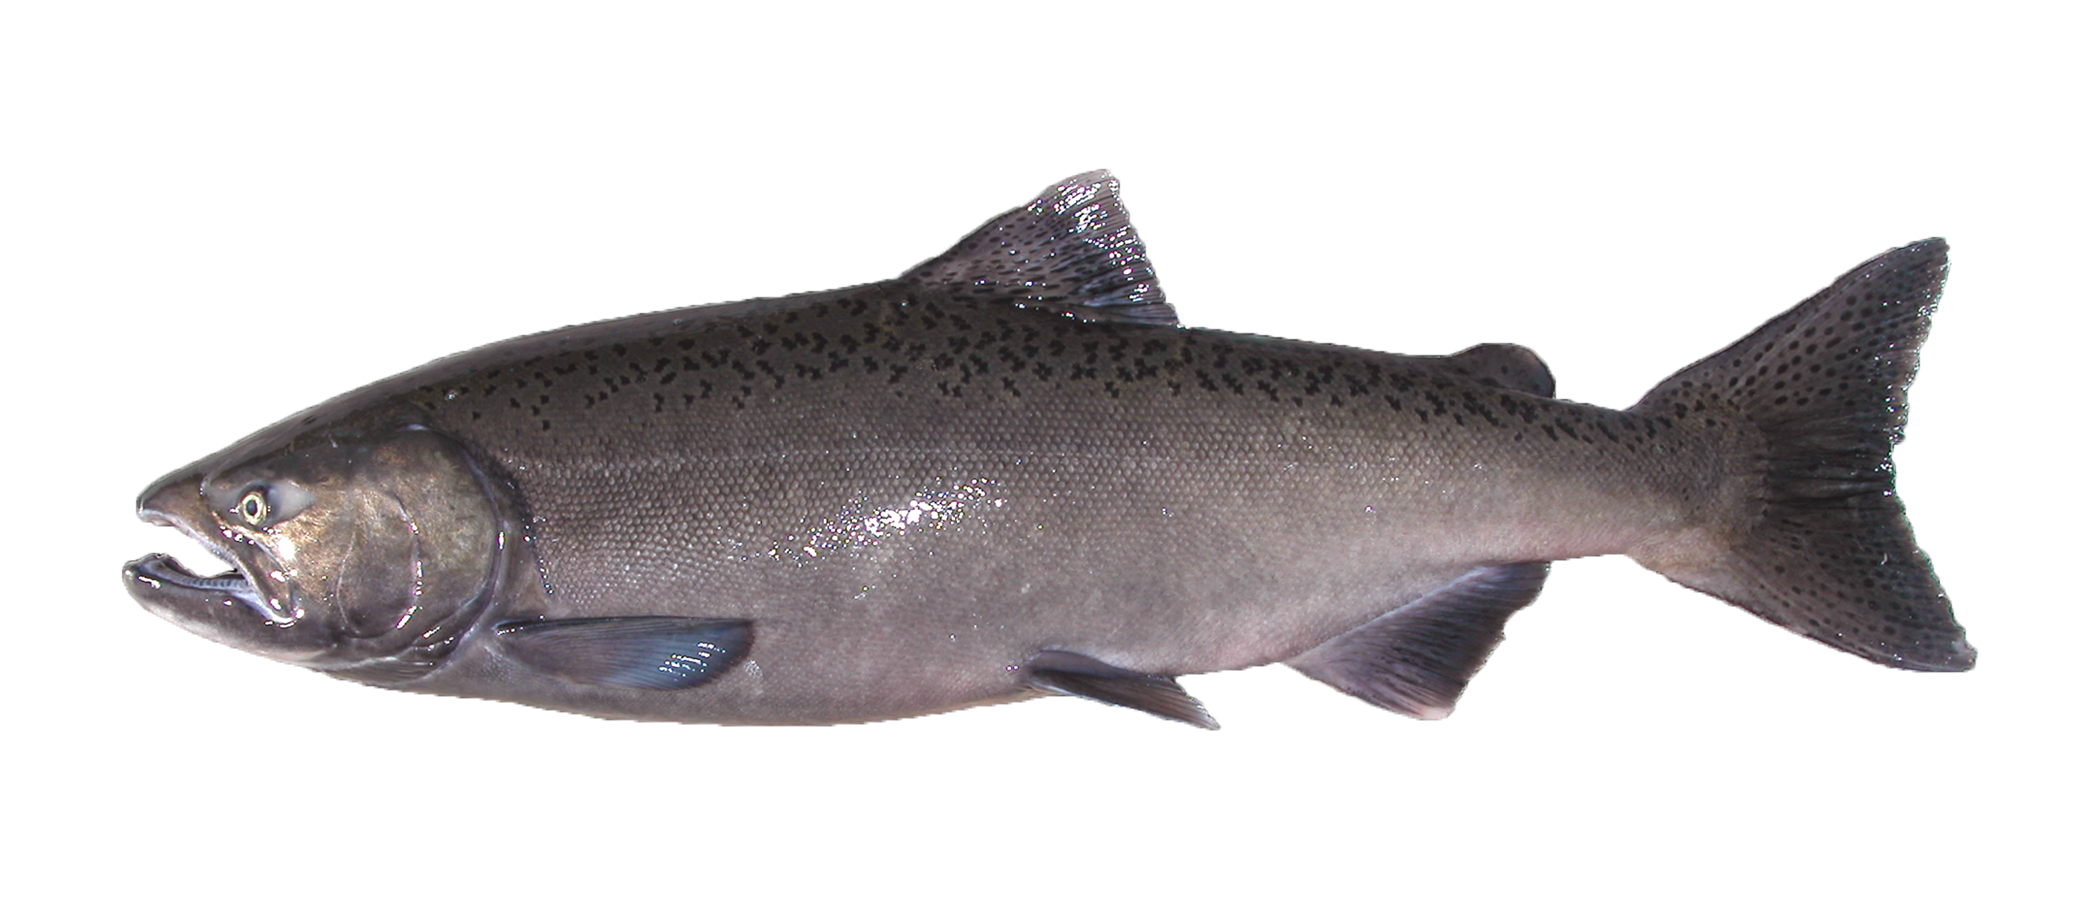
Figure 128: picture of a Chinook Salmon

Figure 129: Graph of American Shad index from 1967 to 2023. Values range from 79.0 to 9360.0.

Figure 130: Graph of white sturgeon catch-per-unit-effort from 1968 to 2022. Values range from 0.9 to 19.3.

Figure 131: Graph of adult Fall-Run Chinook Salmon returns from 1966 to 2023. Values range from 30340.0 to 766668.0.
For more information see: Malinich, T. D., J. Burns, J. White, K. Hieb, R. McKenzie, S. B. Slater, and A. Chorazyczewski. 2021. 2020 Status and Trends Report for Pelagic Fishes in the San Francisco Estuary. IEP Newsletter 40(3):75-97.
Recent Trends
Background
- Many pelagic fishes declined sharply around 2001 in what is known as the Pelagic Organism Decline. Some species have continued to decline over the last 15 years.
- The Fall Midwater Trawl Survey was designed to sample age-0 striped bass, but has provided data on many additional species, including Delta Smelt and Longfin Smelt.
Average Fish Catch Trends by Species
Figure 132: mean is represented by a dotted red line
Figure 133: missing data are represented by tan triangles
Figure 134: picture of delta smelt
Figure 135: picture of a longfin smelt
Figure 136: picture of a striped bass

Figure 137: Graph of Delta Smelt index from 2004 to 2023. Values range from 0.0 to 343.0.

Figure 138: Graph of Longfin Smelt index from 2004 to 2023. Values range from 4.0 to 1949.0.

Figure 139: Graph of young-of-the-year striped bass index from 2004 to 2023. Values range from 42.0 to 470.0.
For more information see: FLOAT-MAST (Flow Alteration - Management Analysis and Synthesis Team). 2021. Synthesis of data and studies relating to Delta Smelt biology in the San Francisco Estuary, emphasizing water year 2017. Interagency Ecological Program, Sacramento, CA.