Summer Report
This report shows trends in water quality, plankton, and fish across multiple IEP surveys for June through August from 1966 to 2024.
Delta Outflow
- Freshwater flow influences water quality, plankton, and fish populations.
- Summer flow is driven primarily by upstream dam releases and exports.
- The long-term average is 10.5.

Figure 48: mean is represented by a dotted red line

Figure 49: Graph of net Delta outflow from 1966 to 2023. Values range from 2.6 to 46.1.
Secchi Depth
Background
- Organisms in this ecosystem are adapted to high turbidity conditions, and reductions in turbidity can have many negative ecological effects.
- Higher values for Secchi depth indicate lower turbidity.
- Secchi depth is measured monthly by DWR’s Environmental Monitoring Program by dropping a black-and-white disk in the water until it disappears.
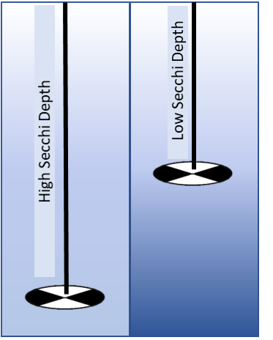
Figure 50: image of a secchi disk
Average Secchi Depth by Region
Figure 51: mean is represented by a dotted red line

Figure 52: missing data are represented by tan triangles

Figure 53: Graph of average summer secchi depth in San Pablo from 1976 to 2023. Values range from 33.8 to 228.2.

Figure 54: Graph of average summer secchi depth in Suisun from 1975 to 2023. Values range from 23.2 to 70.5.

Figure 55: Graph of average summer secchi depth in Delta from 1975 to 2023. Values range from 32.7 to 135.2.
For more information see: Schoellhamer, D. H. 2011. Sudden clearing of estuarine waters upon crossing the threshold from transport to supply regulation of sediment transport as an erodible sediment pool is depleted: San Francisco Bay, 1999. Estuaries and Coasts 34(5):885-899. https://link.springer.com/article/10.1007/s12237-011-9382-x
Water Temperature
Background
- Water temperature is monitored monthly by DWR’s Environmental Monitoring Program.
- High temperature can increase productivity and may trigger harmful algal blooms.
- Increasing Summer temperatures may limit juvenile smelt survival.
- Summer temperatures are lower closer to the ocean and slightly higher in the Delta.

Figure 56: picture of a thermometer in water
Average Temperature by Region
Figure 57: mean is represented by a dotted red line
Figure 58: missing data are represented by tan triangles

Figure 59: Graph of average summer water temperature in San Pablo from 1976 to 2023. Values range from 18.2 to 20.8.

Figure 60: Graph of average summer water temperature in Suisun from 1975 to 2023. Values range from 19.7 to 22.2.

Figure 61: Graph of average summer water temperature in Delta from 1975 to 2023. Values range from 20.8 to 23.9.
For more information see: Bashevkin, S. M., B. Mahardja, and L. R. Brown. 2022. Warming in the upper San Francisco Estuary: Patterns of water temperature change from 5 decades of data. Limnology & Oceanography. doi: https://doi.org/10.1002/lno.12057
Chlorophyll
Background
- Chlorophyll is an indicator of phytoplankton production, which is low during the summer.
- Phytoplankton are the base of the pelagic food web. It is sampled monthly by DWR’s Environmental Monitoring Program.
- The invasion of the clam Potamocorbula amurensis caused a decline in phytoplankton and zooplankton after 1986 – especially in Suisun Bay.
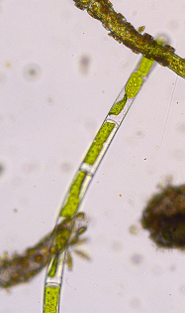
Figure 62: picture of phytoplankton
Average Chlorophyll by Region
Figure 63: mean is represented by a dotted red line
Figure 64: missing data are represented by tan triangles

Figure 65: Graph of average summer chlorophyll in San Pablo from 1976 to 2023. Values range from 1.2 to 22.1.

Figure 66: Graph of average summer chlorophyll in Suisun from 1975 to 2023. Values range from 1.2 to 28.4.

Figure 67: Graph of average summer chlorophyll in Delta from 1975 to 2023. Values range from 2.8 to 32.0.
For more information see: Brown, T. 2021. 2019 Phytoplankton Annual Report. IEP Newsletter 40(2):47-52.
Zooplankton
Background
- Zooplankton is sampled monthly by the CDFW/DWR Environmental Monitoring Program but sampling in San Pablo Bay did not begin until 1998.
- Zooplankton are an important food source for pelagic fish.
- Calanoid copepods and mysids are particularly good fish food. Cyclopoid copepods are not as good for fish food.
- Biomass in summer tends to be the highest of the year, particularly for the calanoid copepod Pseudodiaptomous forbesi.
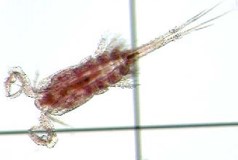
Figure 68: picture of a copepod
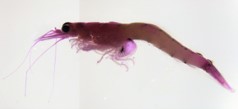
Figure 69: picture of a mysid
Average Zooplankton Biomass by Region
Figure 70: mean is represented by a dotted red line
Figure 71: missing data are represented by tan triangles

Figure 72: Graph of total summer zooplankton biomass in San Pablo from 1998 to 2023. Values range from 1.7 to 10.9.

Figure 73: Graph of total summer zooplankton biomass in Suisun from 1975 to 2023. Values range from 5.2 to 44.7.

Figure 74: Graph of total summer zooplankton biomass in the Delta from 1975 to 2023. Values range from 5.5 to 40.6.
For more information see: Barros, A. 2021. Zooplankton Trends in the upper SFE 1974-2018. IEP Newsletter 40(1):5-14.
Fish
Background
- Delta Smelt, listed as threatened by the Endangered Species Act, have been tracked by CDFW’s Townet Survey since 1959 in Suisun Bay, San Pablo Bay, and the Delta.
- Northern Anchovy are an important forage fish in the brackish-saline regions of the estuary. They are sampled best by CDFW’s San Francisco Bay Study.
- Sacramento Pikeminnow is a native cyprinid that is one of the few piscivorous native fish in the Delta. They are sampled by USFWS’s DJFMP beach seine surveys throughout the estuary.
Average Fish Catch Trends by Species
Figure 75: mean is represented by a dotted red line
Figure 76: missing data are represented by tan triangles
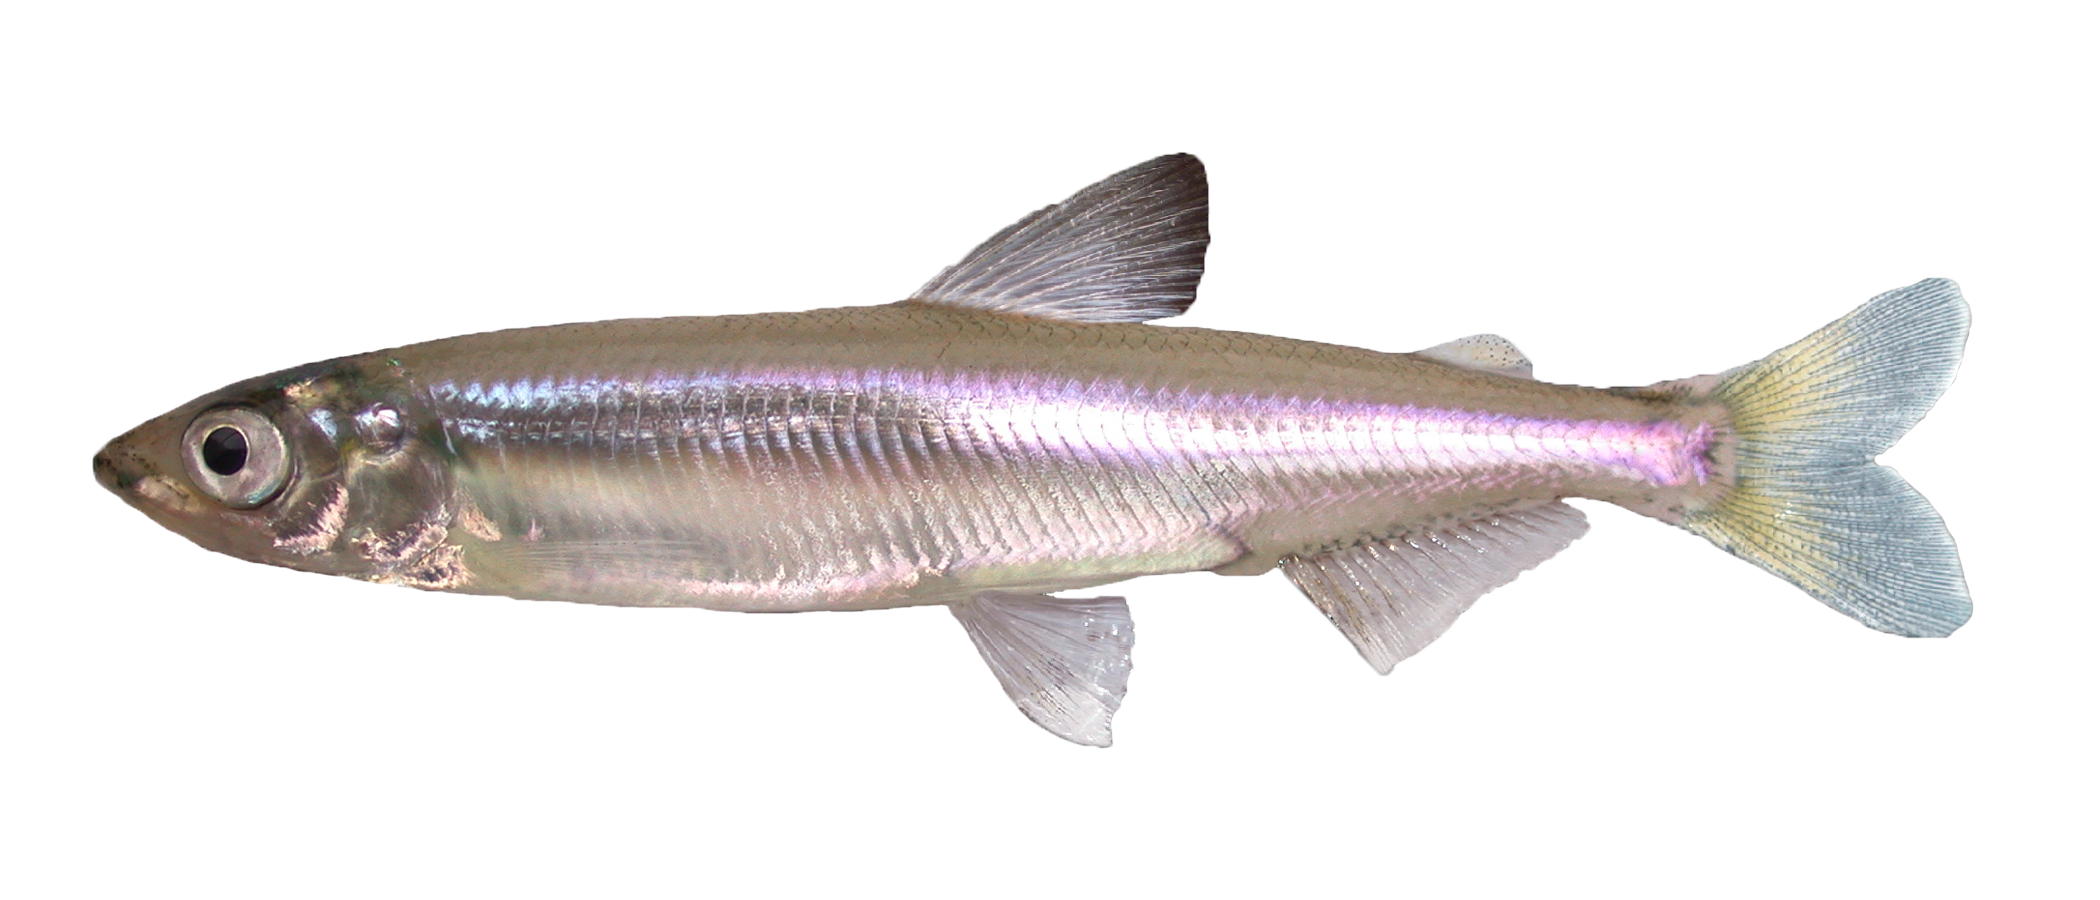
Figure 77: picture of a delta smelt
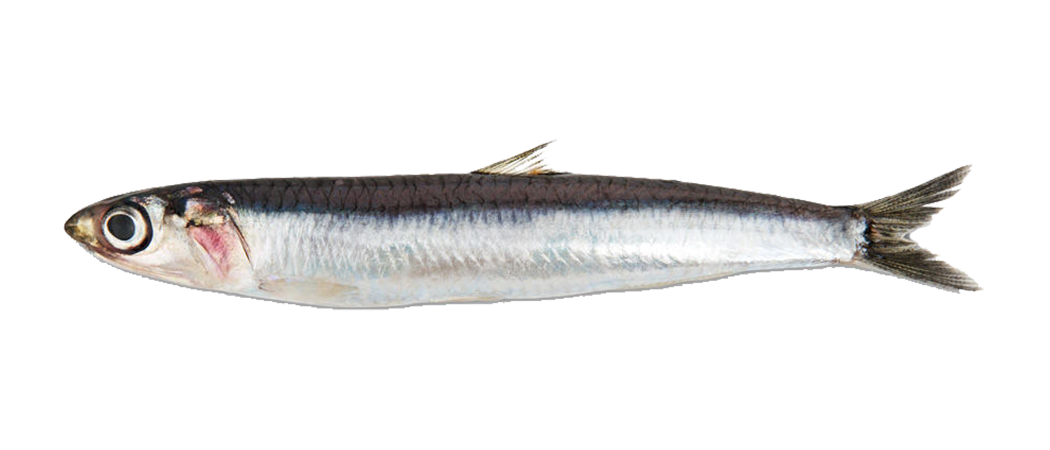
Figure 78: picture of a northern anchovy
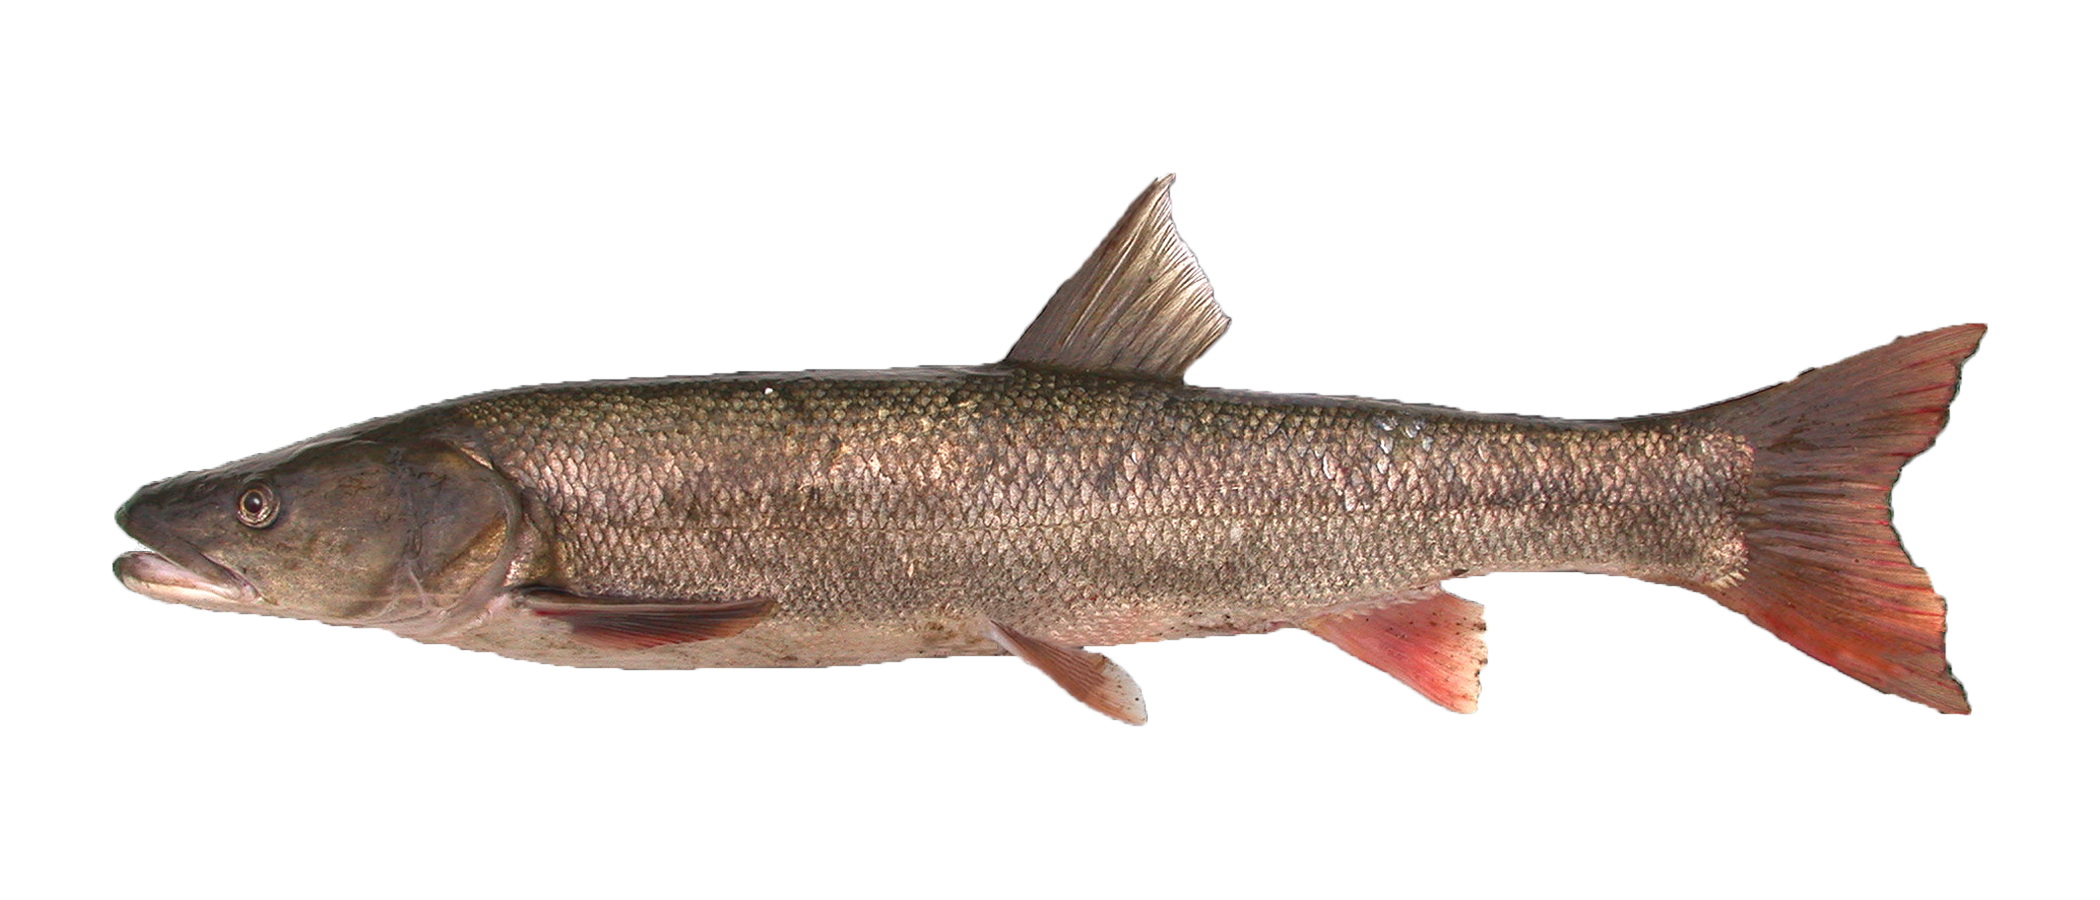
Figure 79: picture of a sacramento pikeminnow

Figure 80: Graph of juvenile Delta Smelt index from 1969 to 2024. Values range from 0.0 to 62.5.

Figure 81: Graph of average northern anchovy CPUE from 1980 to 2023. Values range from 170.5 to 1535.7.

Figure 82: Graph of Pikeminnow index from 1995 to 2024. Values range from 0.0 to 11.4.
For more information see: Malinich, T. D., J. Burns, J. White, K. Hieb, R. McKenzie, S. B. Slater, and A. Chorazyczewski. 2021. 2020 Status and Trends Report for Pelagic Fishes in the San Francisco Estuary. IEP Newsletter 40(3):75-97.
McKenzie, R. 2021. 2019–2020 Delta Juvenile Fish Monitoring Program - Nearshore Fishes Annual Report. IEP Newsletter 40(2):13-24.
Recent Trends
Background
- Delta Smelt have been in severe decline over the past two decades, with a Summer Townet Survey index of zero in 2015, 2016, 2018, and 2019.
- Microcystis is a toxic cyanobacteria first found in the Delta in 1998. Microcystis presence has been documented by the Environmental Monitoring Program and the CDFW Summer Townet Survey during their water quality sampling.
- Aquatic vegetation in the Delta has increased significantly in recent years. This vegetation is composed mostly of non-native invasive plant species and is categorized as either floating or submerged types. Coverage is estimated by UC-Davis using remote sensing of the North and Central Delta.
Average Trends by Parameter
Figure 83: mean is represented by a dotted red line
Figure 84: missing data are represented by tan triangles
Figure 85: picture of delta smelt
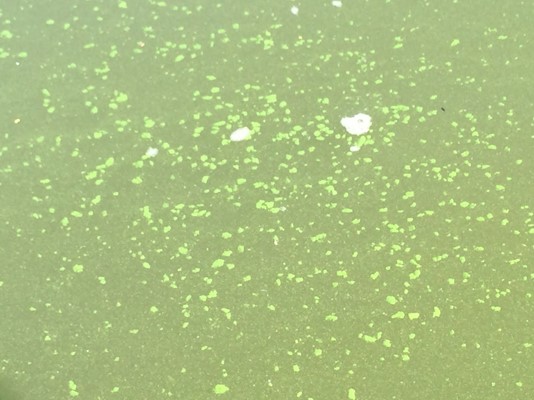
Figure 86: water with flakes of microcystis floating in it
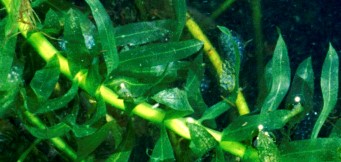
Figure 87: stem of the plant egeria densa

Figure 88: Graph of juvenile Delta Smelt index from 2004 to 2024. Values range from 0.0 to 2.9.

Figure 89: Graph of microcystis abundance from 2007 to 2023.

Figure 90: Graph of percentage of water area occupied by aquatic vegetation from 2004 to 2022. Values range from 7.6 to 32.0.
For more information see:
Rasmussen, N., J. L. Conrad, H. Green, S. Khanna, J. Caudill, P. Gilbert, P. Goertler, H. Wright, K. Hoffmann, S. Lesmeister, J. Jenkins, L. Takata, D. Boswort, T. Flynn, E. Hard, and T. Sommer. 2020. 2017-2018 Delta Smelt Resiliency Strategy Action for Enhanced Control of Aquatic Weeds and Understanding Effects of Herbicide Treatment on Habitat, Interagency Ecological Program, Sacramento, CA. 332 pg.
Lehman, P. W., T. Kurobe, K. Huynh, S. Lesmeister, and S. J. Teh. 2021. Covariance of Phytoplankton, Bacteria, and Zooplankton Communities Within Microcystis Blooms in San Francisco Estuary. Frontiers in Microbiology 12(1184). doi: https://doi.org/10.3389/fmicb.2021.632264