Column plot template for IEP Seasonal Monitoring Report figures
standard_column_plot.RdA template function for producing column plots for the IEP Seasonal Monitoring Report.
standard_column_plot(
  data,
  mapping,
  report_year,
  season = c("annual", "winter", "spring", "summer", "fall"),
  type = c("all", "recent"),
  nudge.factor = 0.015,
  ...
)
Arguments
| data | Default dataset to use for plot. If not already a data.frame,
will be converted to one by |
|---|---|
| mapping | Default list of aesthetic mappings to use for plot. If not specified, must be supplied in each layer added to the plot. |
| report_year | The user-defined report year for the Seasonal Monitoring Report. Must be an integer. |
| season | The season for the Seasonal Monitoring Report.
Must be one of the following: |
| type | The scale type to use. |
| nudge.factor | Vertical nudge of missing data symbols, as a fraction of the data range. Default is 0.015 (1.5%). |
| ... | other arguments to pass to |
Examples
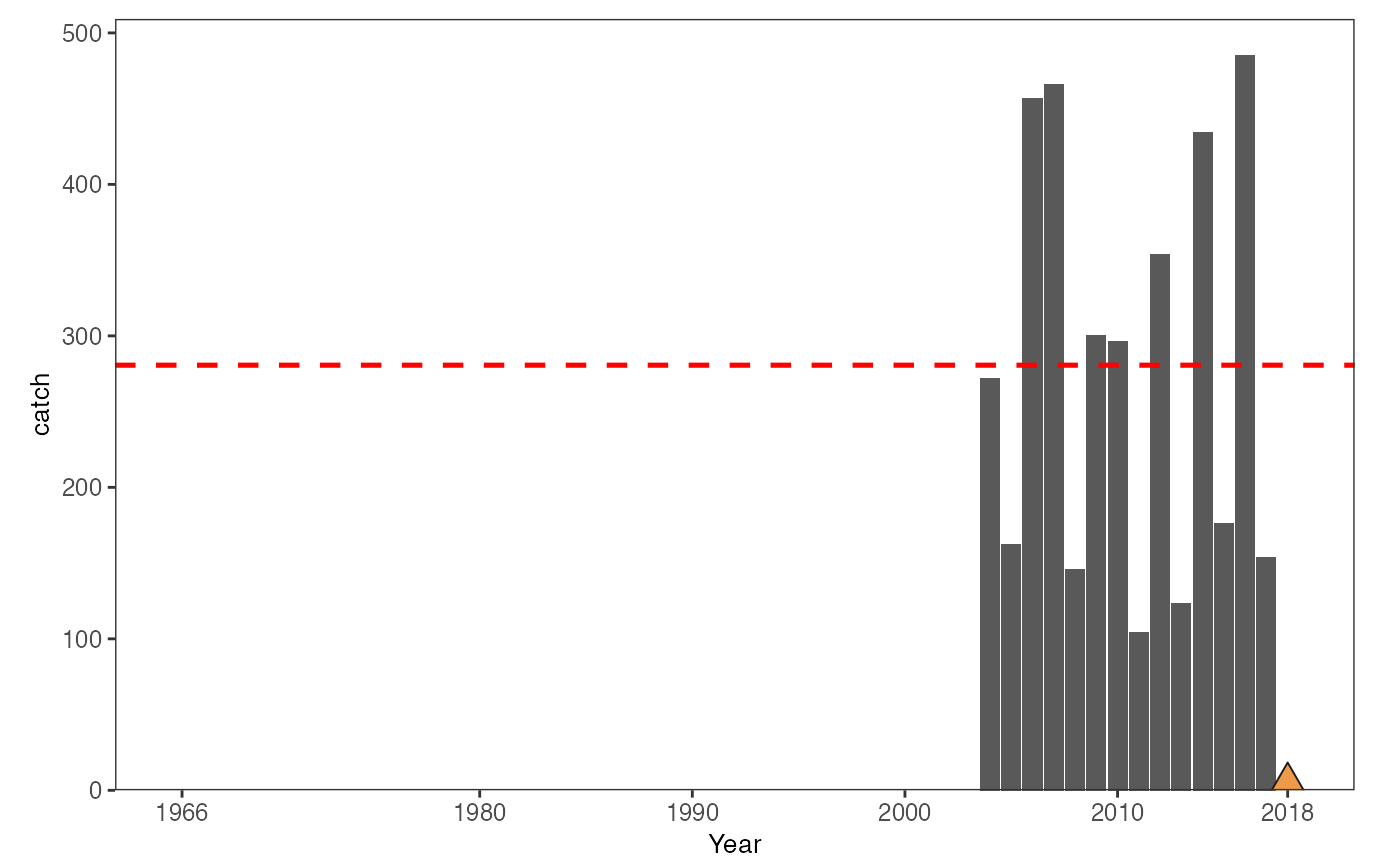
test = data.frame(year = 2004:2018, catch = c(sample(100:500, 14), NA)) standard_column_plot(test, aes(x = year, y = catch), 2018)#> Warning: Removed 1 rows containing non-finite values (stat_missing).#> Warning: Removed 1 rows containing non-finite values (stat_l_tavg).#> Warning: Removed 1 rows containing missing values (position_stack).